How do you graph #y=sqrt(x+4)#?

1 Answer
Jun 20, 2015

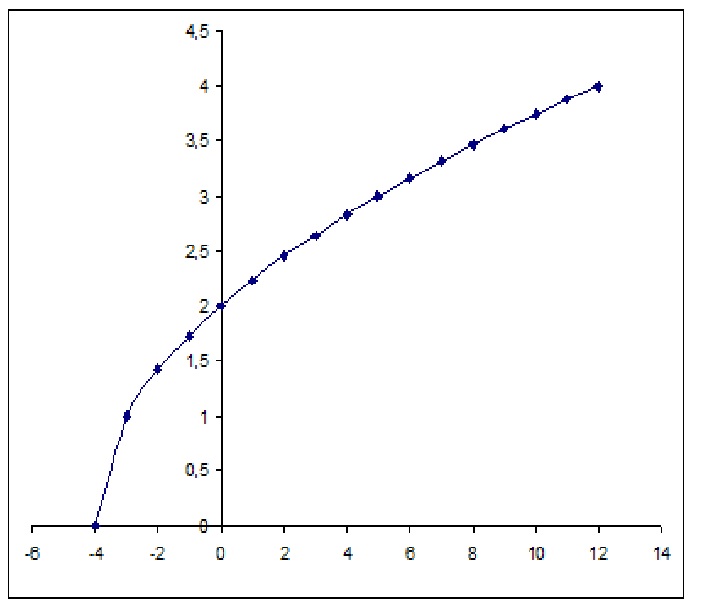
You get hal parabola but along the x axis...have a look:

Explanation:

First of all you need to discover the allowed #x# values for your function, the domain .
The square root can accept all #x# as long as its argument doesn't get negative (you cannot find a real number as solution of a negative square root). You need all the #x# such that:
#x+4>=0# or:
#x>=-4#
Your domain is then all the x bigger or equal to #-4#:

Next we choose "good" values for #x# to be used into our function (are good because they allow to evaluate the square root easily):

#x=-4# then #y=sqrt(0)=0#
#x=-3# then #y=sqrt(1)=1#
#x=0# then #y=sqrt(4)=2#
#x=5# then #y=sqrt(9)=3#
#x=12# then #y=sqrt(16)=4

Plotting these points you get:
enter image source here