How do you graph #y=sqrt(x+5)#, compare it to the parent graph and what is the domain and range?

1 Answer
Feb 25, 2018

Domain #x in[-5,+oo)#
Range #y in [o,+oo)#

Explanation:

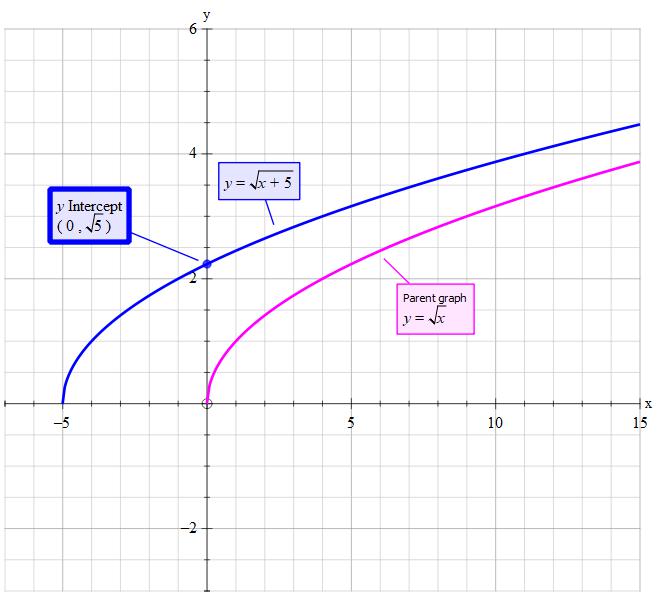
Assumption: The parent graph is #y=sqrt(x)#

Although 'true' square root is #+-# it is not stated as such in the question. We only have + so this is what is called the principle square root. The condition #+-# produces the shape #sub# so as we only have the positive half of the condition #+-# we end up with only the top half of the shape #sub#

For the value to NOT go into the complex number set of values the 'content' of the root must not become negative.

Thus the minimum value is such that #x+5=0 =>x=-5#.

The 'action' of changing #y=sqrt(x)" to "y=sqrt(x+5)# 'moves' the graph of #y=sqrt(x)# to the left on the x-axis by 5.

The x-intercept is at #y=0 =sqrt(x+5)# thus #x_("intercept")=-5#
The y-intercept is at #x=0 => y=sqrt(5) ~~2.24# to 2dp
Domain #x in[-5,+oo)#
Range #y in [o,+oo)#

Tony B