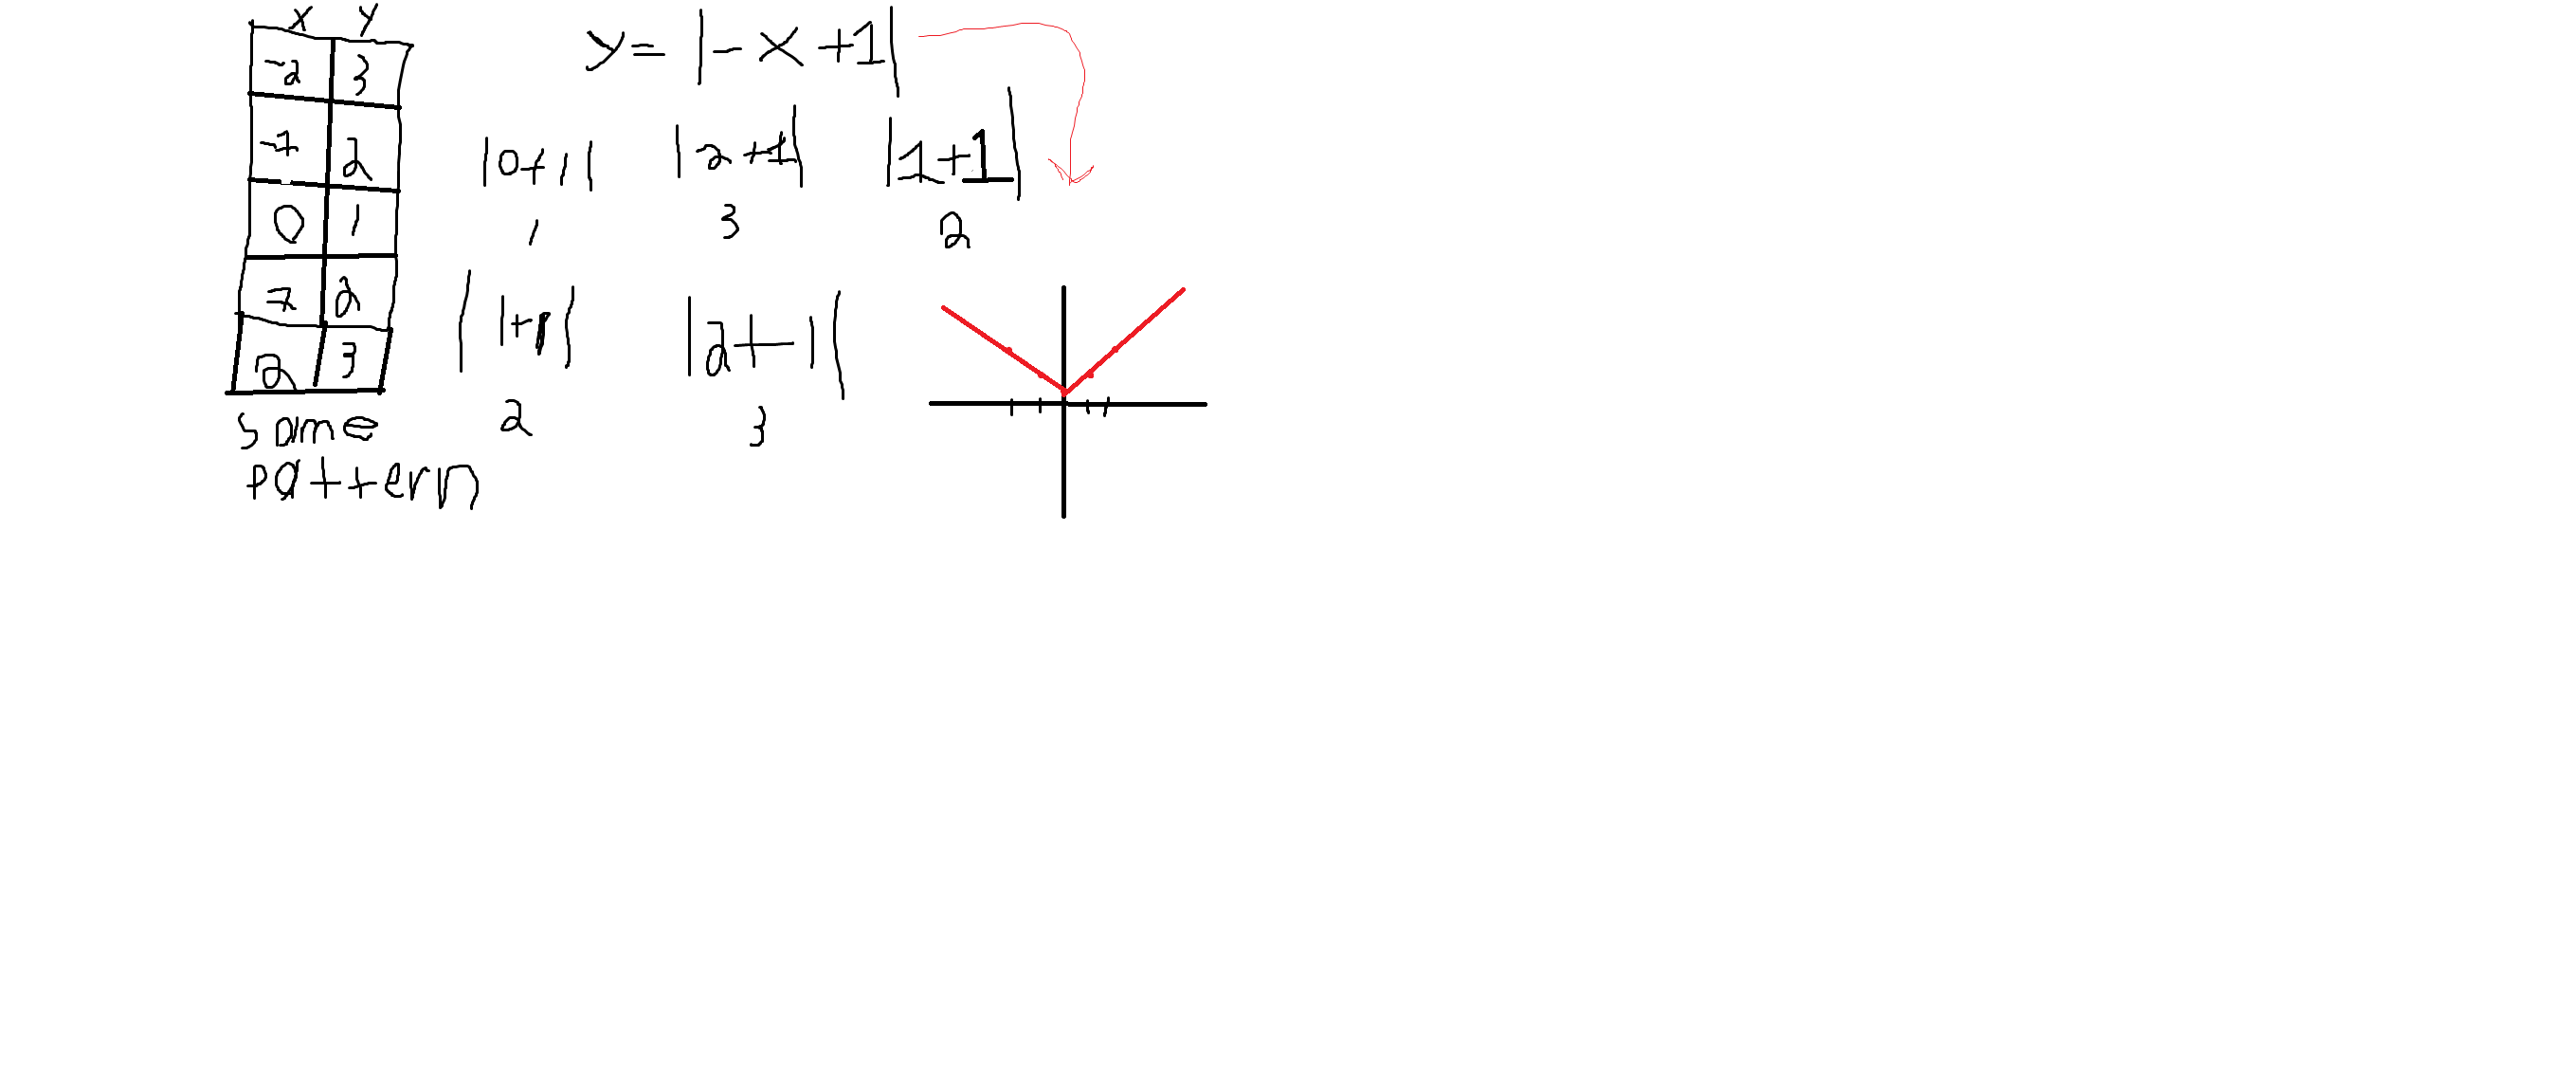
How do you graph y= | -x + 1| ? Algebra Linear Inequalities and Absolute Value Graphs of Absolute Value Equations 1 Answer jonathan n. Oct 18, 2017 See below Explanation: make a table of points, then graph Paint Answer link Related questions How do you graph absolute value equations on a coordinate plane? How do you create a table of values for an absolute value equation? How do you know which x values to choose when creating a table of values for an absolute value equation? What is the shape of an absolute value graph? How do you find a vertex by looking at an absolute value equation? How do you graph the equation y=|x+2|+3? Which x values do you choose to create a (x, y) table for y=|x+5| ? How do you graph y=4|x|-2? Where is the vertex for y= |x/3-4 |? How do you graph f(x)=abs(x-3)+4? See all questions in Graphs of Absolute Value Equations Impact of this question 1632 views around the world You can reuse this answer Creative Commons License