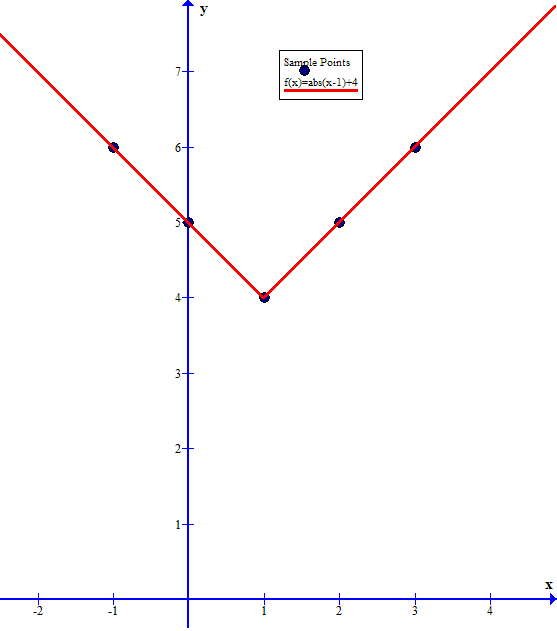
How do you graph #y=|x-1| +4#?

2 Answers
Mar 7, 2018

See the explanation below

Explanation:

Start by graphing

#y=|x|#

The function is defined for #x in RR#

#y=0# when #x=0#

When #x>0#, #y=x#

and

When #x<0#, #y=-(x)=-x#

graph{|x| [-7.15, 8.654, -0.39, 7.51]}

Next graph,

#y=|x-1|#

The graph of #y=|x|# is shifted one unit to the right

graph{|x-1| [-7.15, 8.654, -0.39, 7.51]}

And finally, graph

#y=|x-1|+4#

The graph #y=|x-1|# is shifted vertically by #4# units.

graph{|x-1|+4 [-7.15, 8.654, -0.39, 7.51]}

Mar 7, 2018

Your graph should look like:
enter image source here

Explanation:

Generate a few sample points,
one for which #abs(x-1)=0#
and a couple for each of
#color(white)("XXX")(x-1) < 0color(white)("xx")"and"color(white)("xx")(x-1) > 0#

The sample points I used were
#color(white)("XXX"){: (color(white)("x")ul(x),color(white)("xxxx"),ul(y=abs(x-1)+4)), (color(white)("x")1,,color(white)("xxx")4), (color(white)("x")0,,color(white)("xxx")5), (-1,,color(white)("xxx")6), (color(white)("x")2,,color(white)("xxx")5), (color(white)("x")3,,color(white)("xxx")6) :}#

Plot these points on the Cartesian plane
and draw straight lines extending from the vertex point (where #abs(x-1)=0#) through each of the two sets of points.