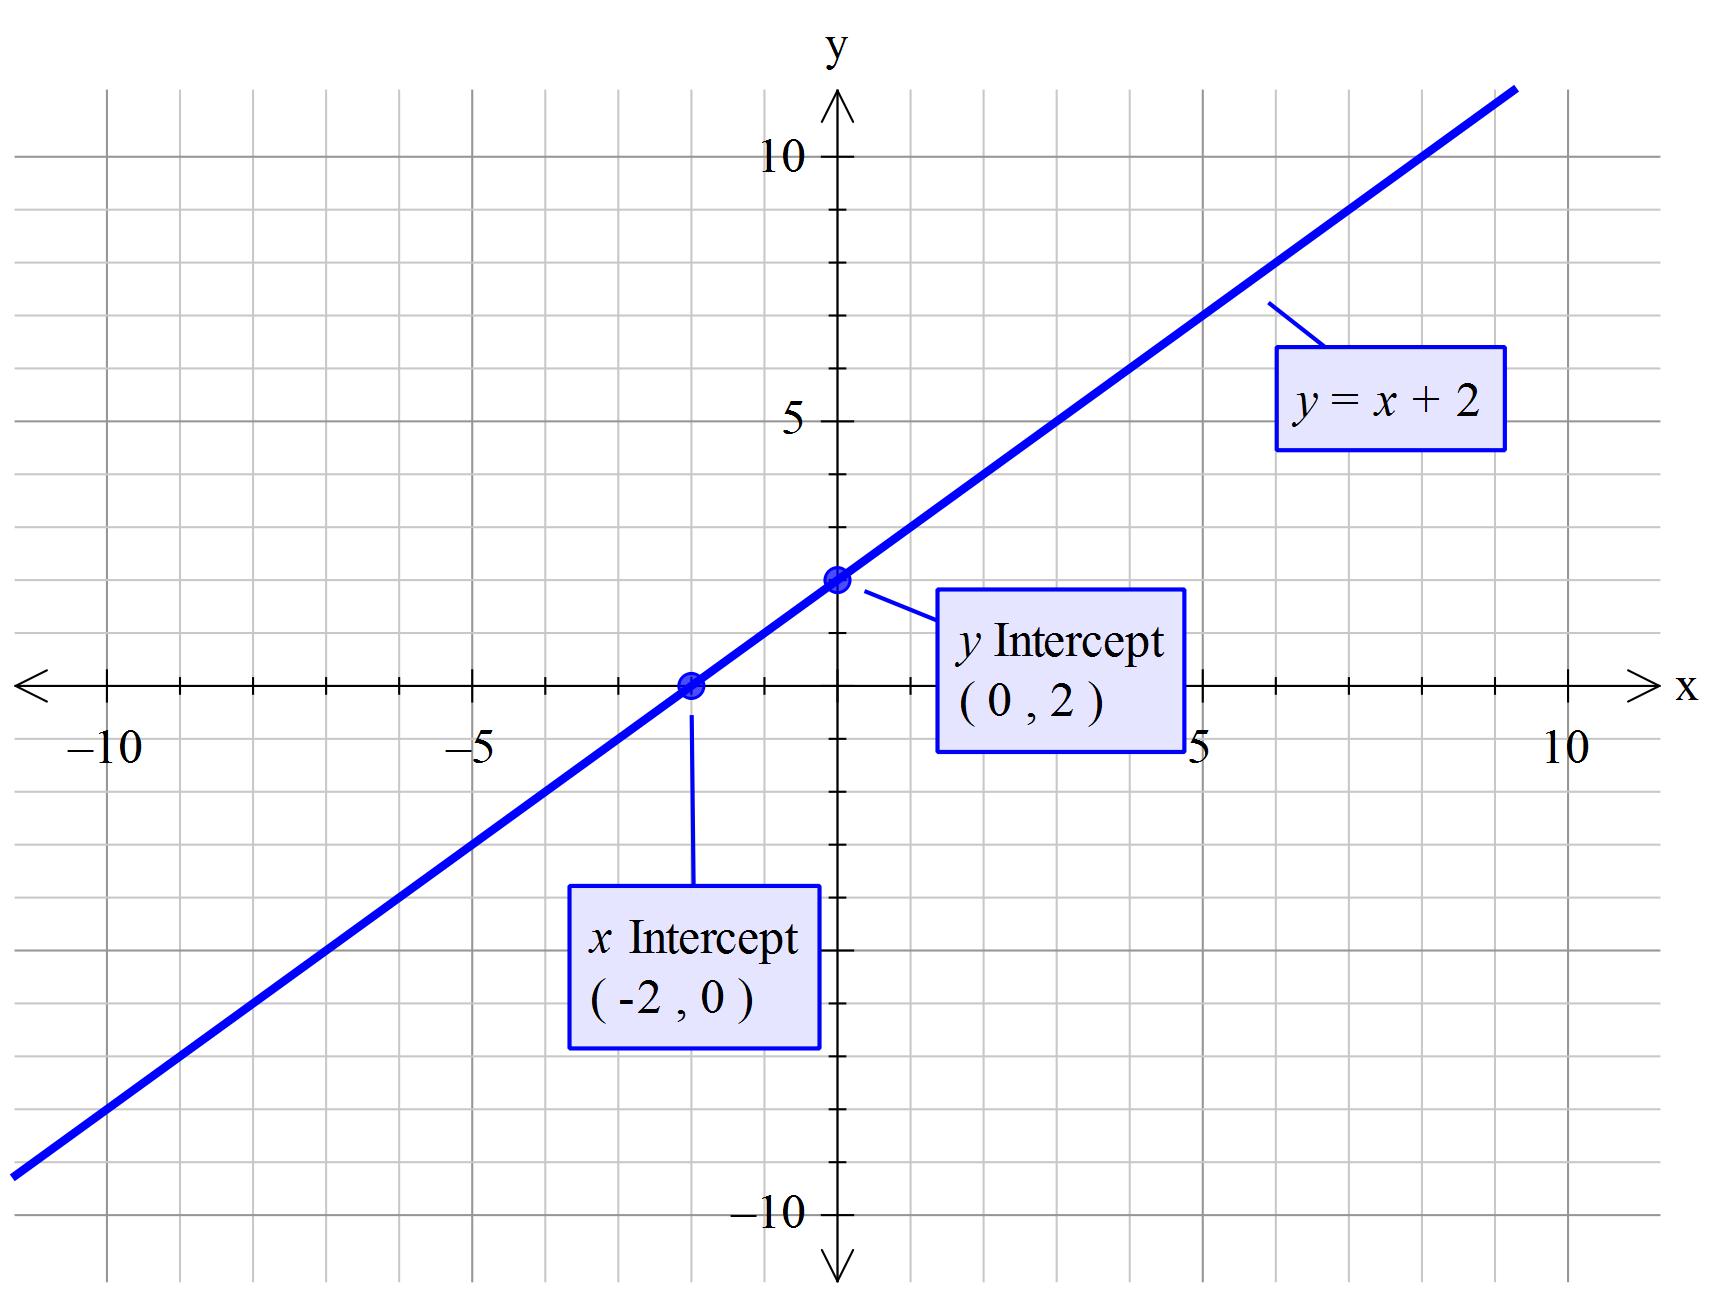
How do you graph # y=x+2#?
1 Answer
Mar 13, 2016
See explanation
Explanation:
Consider first
This means that whatever value you give to x ands up being the value of
Now think about the
This has the effect of lifting the graph up by the value of 2.
Build a table of values. Plot the points and draw the line.
So we end up with:


