How do you graph #y=x^3 + 3x^2 - 6x#?
2 Answers
graph{y=x^3+3x^2-6x [-10, 10, -5.08, 4.92]}
Explanation:
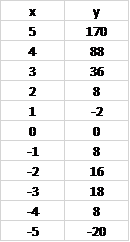
Make a table for
Plot
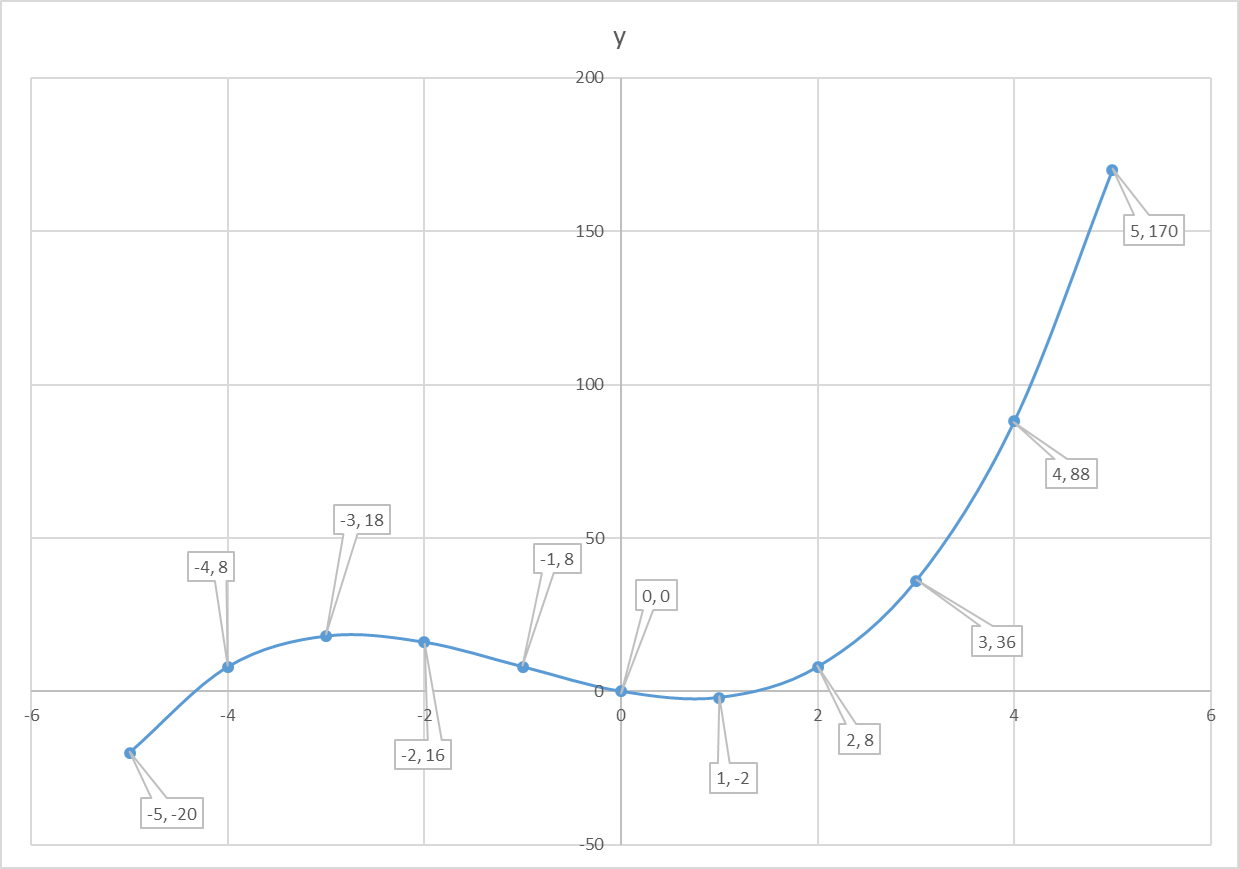
Connect the dots.
Finished graph should look like this:
graph{y=x^3+3x^2-6x [-10, 10, -5.08, 4.92]}

Refer Explanation section
Explanation:
Given -
#y=x^3+3x^2-6x#
There is no constant term in the function. Hence, the curve passes through the origin.
Moreover, the turning points in the curve are very very important. This will help us to decide the range of
#dy/dx=3x^2+6x-6#
#dy/dx=>3x^2+6x-6=0#
We shall try to solve using completing the square method.
#3x^2+6x=6#
#x^2+2x=2# -- [devide all the terms by 3]
#x^2+2x+1=2+1# -- [take half of the coefficient of x, square it and add it to both sides]
#(x+1)^2=3#
#x+1=+-sqrt3#
#x=+-sqrt3-1#
#x=1.732-1=0.732#
#x=-1.732-1=-2.732#
At
Select a range of