How do you graph y= |x+4| by plotting points?
1 Answer

Oct 11, 2017
see below...
Explanation:
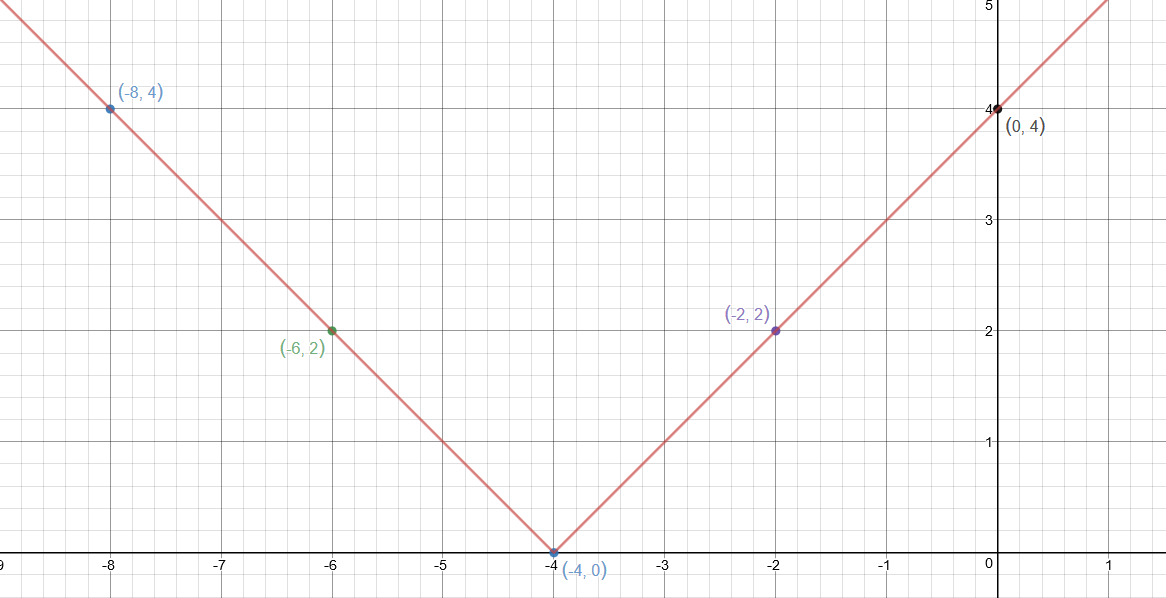
graph{y=abs(x+4) [-14.33, 5.67, -1.52, 8.48]}
Pick
Like : (note how the
y=abs(-8+4)=abs(-4)=4->(-8,4) y=abs(-6+4)=abs(-2)=2->(-6,2) y=abs(-4+4)=abs(0)=0->(-4,0) y=abs(-2+4)=abs(2)=2->(-2,2) y=abs(0+4)=abs(4)=4->(0,4) y=abs(2+4)=abs(6)=6->(2,6)