How do you graph #y = |x+5|#?
1 Answer

See the explanation about method.
Explanation:
Build a table for
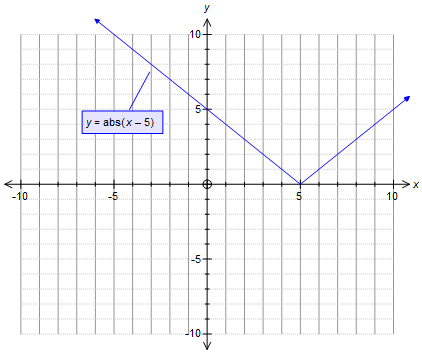
Use this table to plot points. However; this is a plot involving two straight lines that make a V shape. So, in theory you only need 3 points.
The y-intercept is at
'~~~~~~~~~~~~~~~~~~~~~~~~~~~~~~~~~~~~~~~
The x-intercept is at
Add
'~~~~~~~~~~~~~~~~~~~~~~~~~~~~~~~~~~~~~~~~
The third point will be a reflection of the first point about the axis of symmetry of
So the x-coordinate will be
The y coordinate will be the same as
'~~~~~~~~~~~~~~~~~~~~~~~~~~~~~~~~~~
Both of these plotted lines will be extended upwards to the edge of the graph.