How do you plot the polar coordinate #(-3, (3pi)/4)#?
1 Answer
The polar coordinate
Explanation:
We remember that the polar coordinate is written as
Here the length
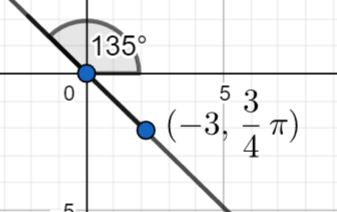
(Normally we would expect r to only take positive values as it is the length of a line. But if we interpret the negative value as being the opposite direction of the positive value, we find that our value ends up in the fourth quadrant, as on the graph.)
From the graph and by using trigonometric functions we get the following conversion to cartesian coordinates (x, y):
The cartesian coordinate, therefore, is
Which is the point on the graph above.
