How do you sketch a graph of #h(x)=5+frac{1}{2} \sec 4x# over the interval #[0,2pi]#?
1 Answer

Nov 6, 2014
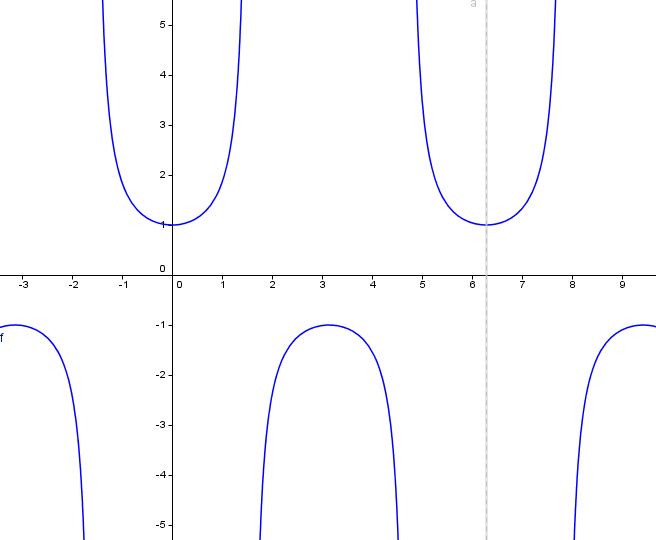
Step 1: Sketch the graph of
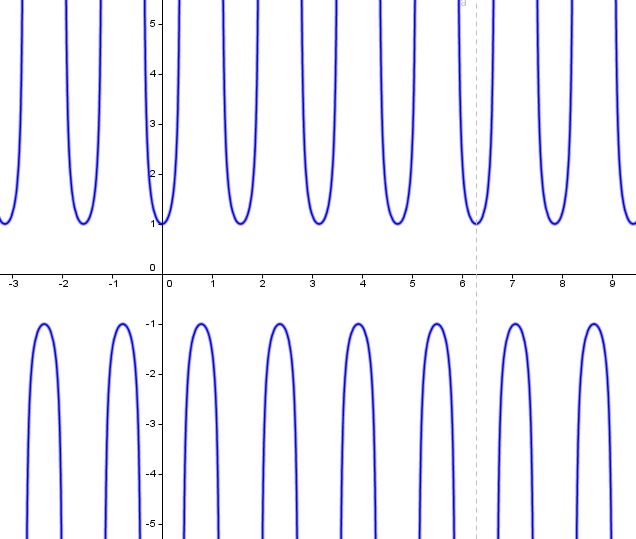
Step 2: Horizontally shrink the graph in Step 1 by a factor of 4.
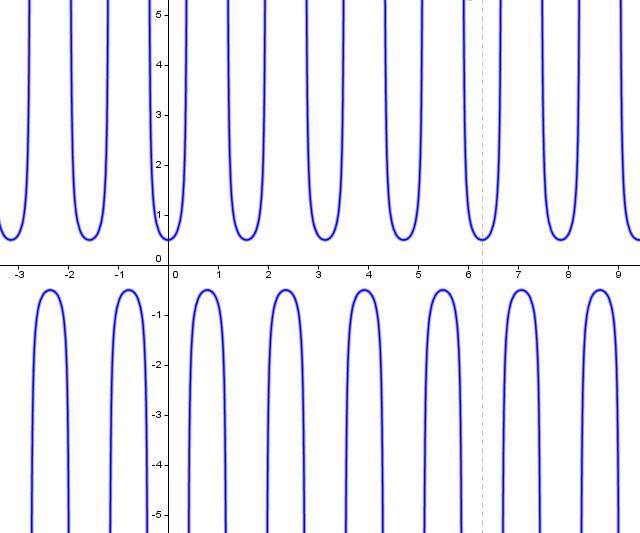
Step 3: Vertically shrink the graph in Step 2 by a factor of 2.
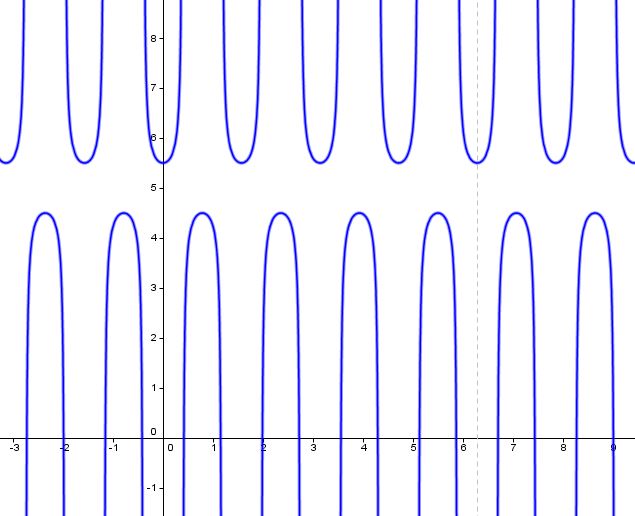
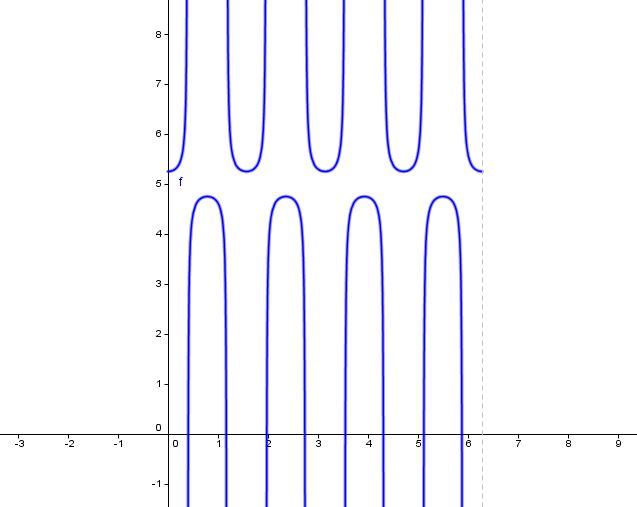
Step 4: Shift up the graph in Step 3 by 5 units.
Step 5: Keep the part of the graph in Step 4 on
I hope that this was helpful.
