How do you sketch the graph of #y=1/2x^2# and describe the transformation?
1 Answer

Please read the explanation.
Explanation:
We have the quadratic equation:
Consider the Parent Function:
The General Form of a quadratic equation is:
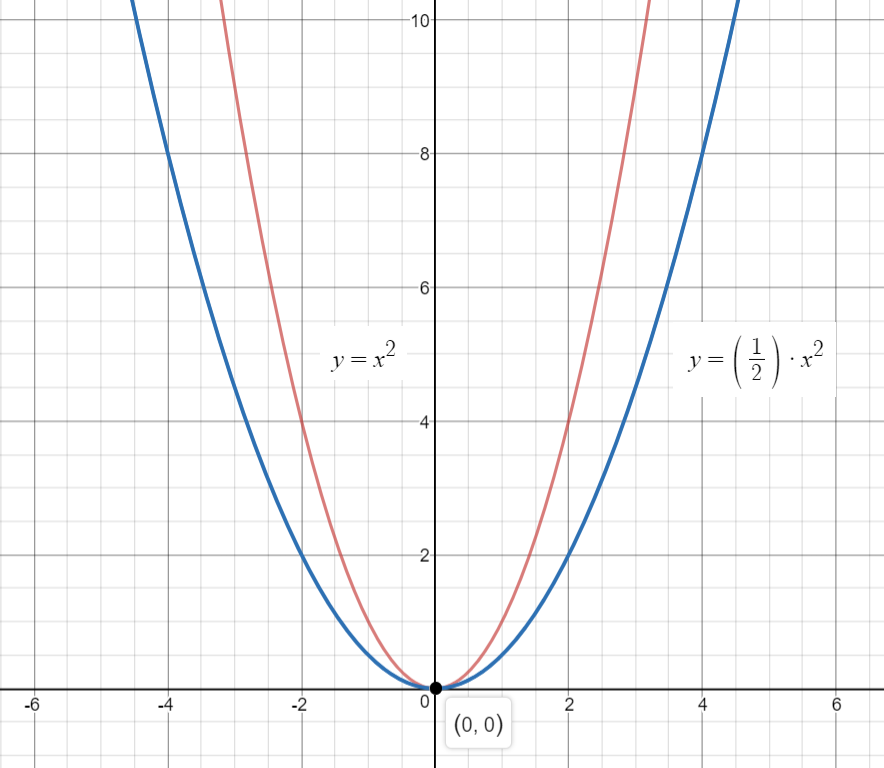
The graph of
pass through the origin
and the graphs uses both Quadrant-I and Quadrant-II.
Let us now look at the transformation of the graph.
Consider the format :
Since, in the problem,
there will be a vertical compression toward the x-axis.
The graph is below:
Note that the graphs of
are available together to examine the transformation.