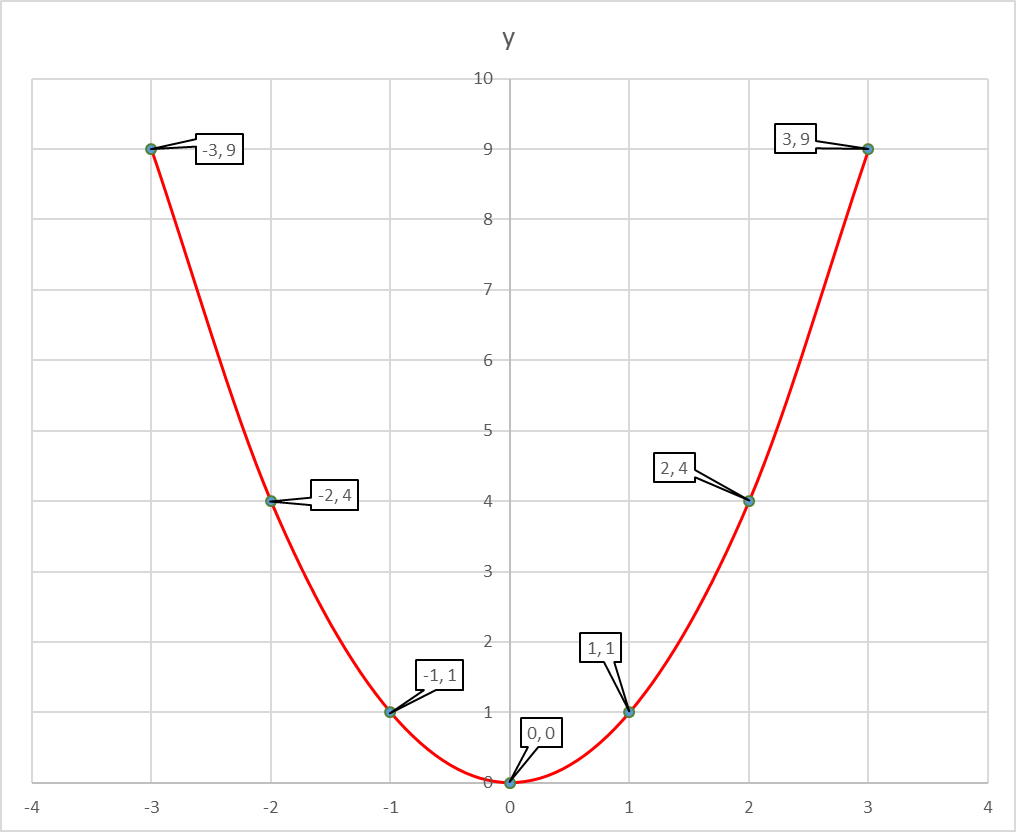
How do you sketch the graph of #y=-x^2# and describe the transformation?
1 Answer
Dec 28, 2017
Refer Explanation Section.
Explanation:
Given -
#y=-x^2#
There is no constant term in the given equation. Hence it passes through the origin.
Take a few points less than and greater than zero. These are the likely values variable
Tabulate them as follows.

Graph them

The curve takes a turn at

