How do you sketch the graph of #y=(x-4)^2# and describe the transformation?
2 Answers
see below
Explanation:
The graph of
graph{(x-4)^2 [-7.58, 12.42, -2.96, 7.04]}
The transformation from the parent graph
See explanation
Explanation:
The first step in any transformation problem is identify the parent function. We know the function is a parabola since the variable has a power of
To begin graphing, we can start with graphing the parent function (that is
graph{x^2 [-10, 10, -2, 5]}
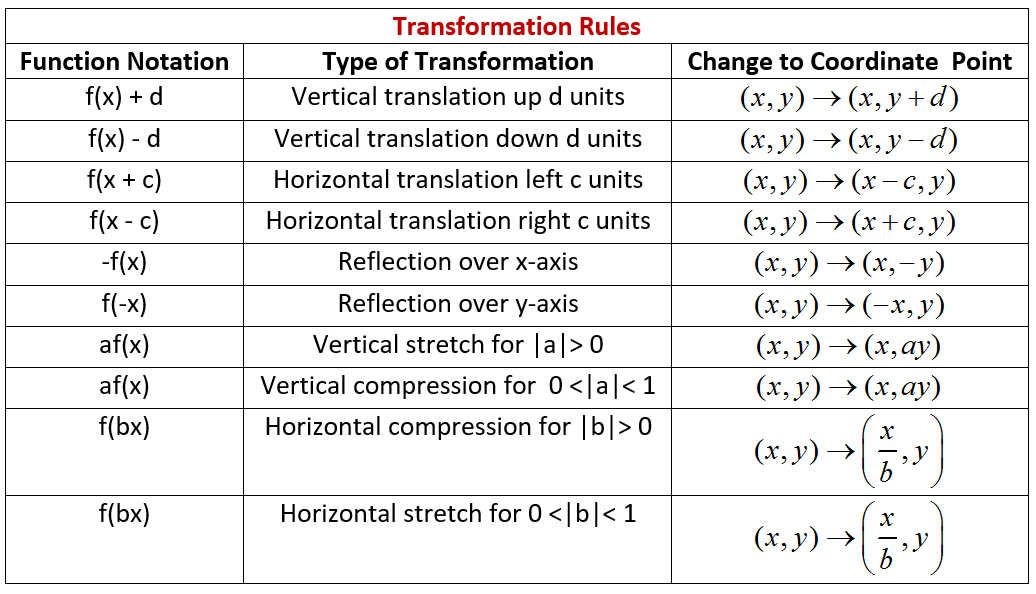
If we recall our transformation rules, we would know that the graph
Here is a graph with the original function and the final function just so you can see that all we really did was shift the function
This table on transformation rules may be of good use:


