How do you solve and graph the compound inequality x- 3 > 3 and -x + 1 < -2 ?
1 Answer

Please read the explanation.
Explanation:
We are given the Compound Inequality:
We can solve these inequalities separately.
Since
the final result will be the intersection of the two given inequalities.
Inequality-1
Add
Inequality-2
Subtract
Multiply both sides of the inequality by
Using the intermediate results (Res.1) and (Res.2), we get
FINAL SOLUTION:
Using Interval Notation:
Important Note:
Dotted Lines in all the graphs below represent a solution that does not include a certain value, indicated by the dotted line.
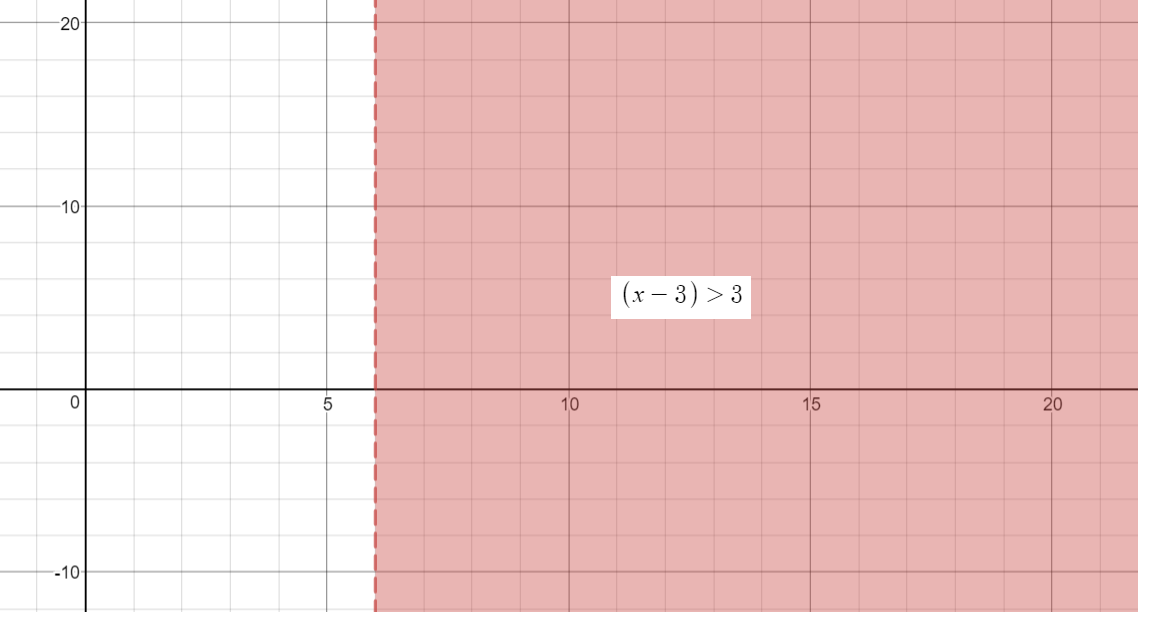
Graph.1
Graph of the inequality:
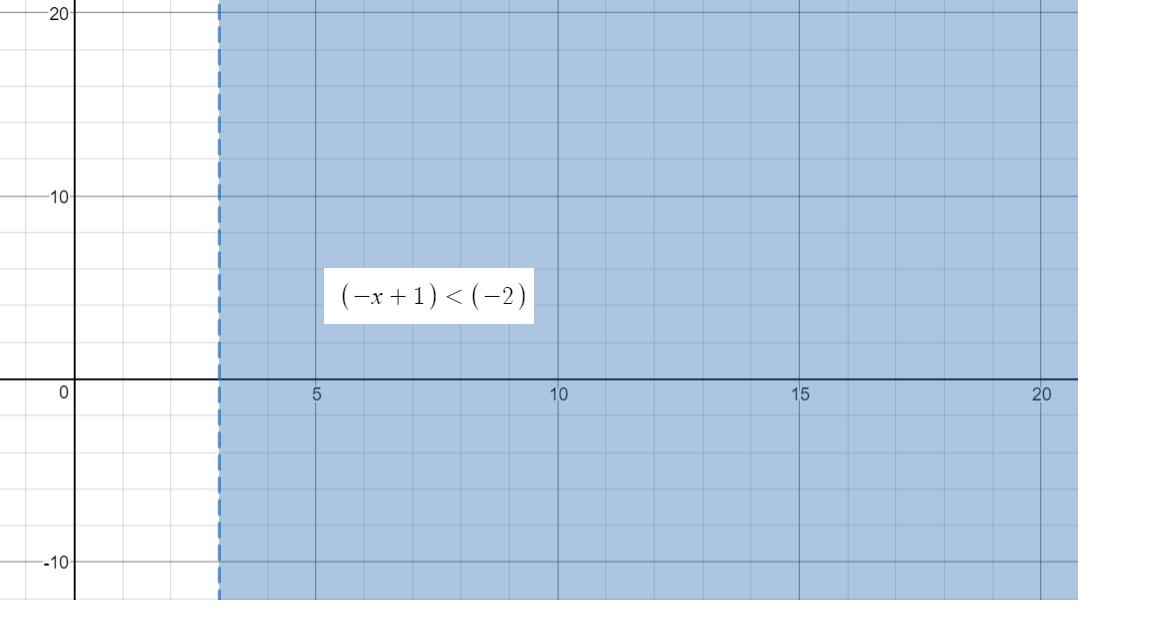
Graph.2
Graph of the inequality:
Graph.3: Solution Graph
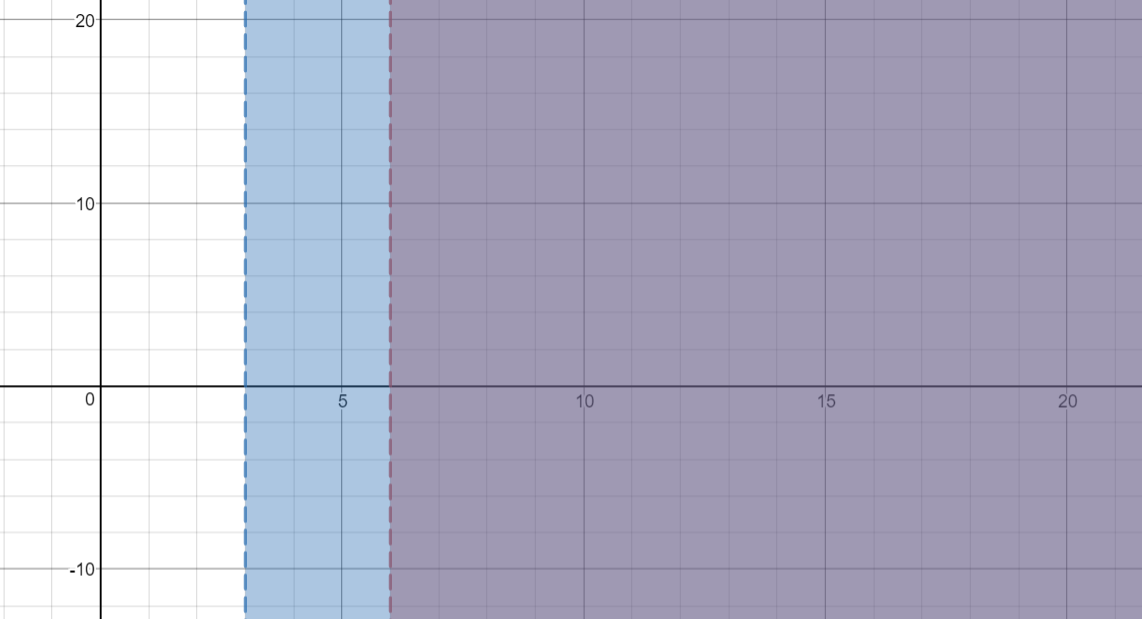
Overlapping area in the graph is our required solution,
Compare this graph with the following graph.
Both the graphs represent the same solution.
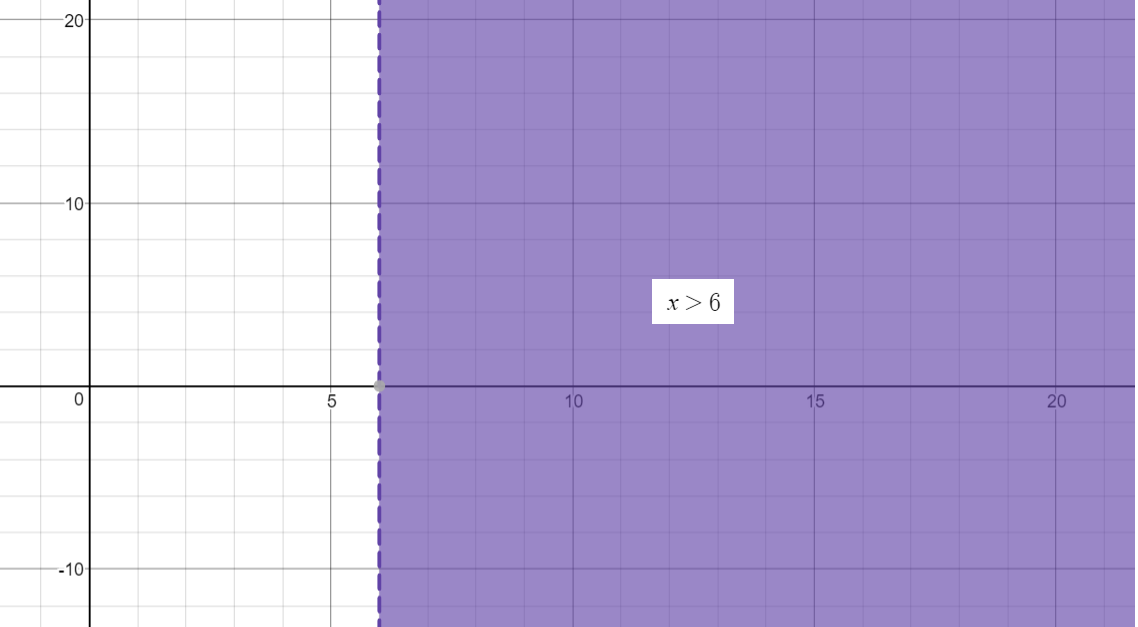
Graph.4: Solution Graph
Hope this helps.
