A quadratic equation graph is of a general shape. In this question #7x^2# is negative. So the general shape is #nn#
Suppose that #7x^2# had been positive then its general shape is #uu#
Why is this important? It is a direct indicator of if the vertex is a maximum or a minimum.
#color(brown)("Consider what I will call the 'base line graph' of "y=x^2)#
#color(blue)("Point 1: ")# In this case the coefficient of #x# is (+1) the
#" "# general shape is #uu# thus the vertex in a minimum
#color(blue)("Point 2: ")# Suppose I add a constant of say 3. What this does is lift
#" "#the graph of #y=x^2# upwards by 3. In the same way, if
#" "# the constant was -3 then it would lower the graph
#color(blue)("Point 3: ")#Suppose the equation was #y=x^2+6x#
#" "#The #6x# shifts the graph sideways in such a way that the
#" "#axis of symmetry is #(-1/2xx6)#
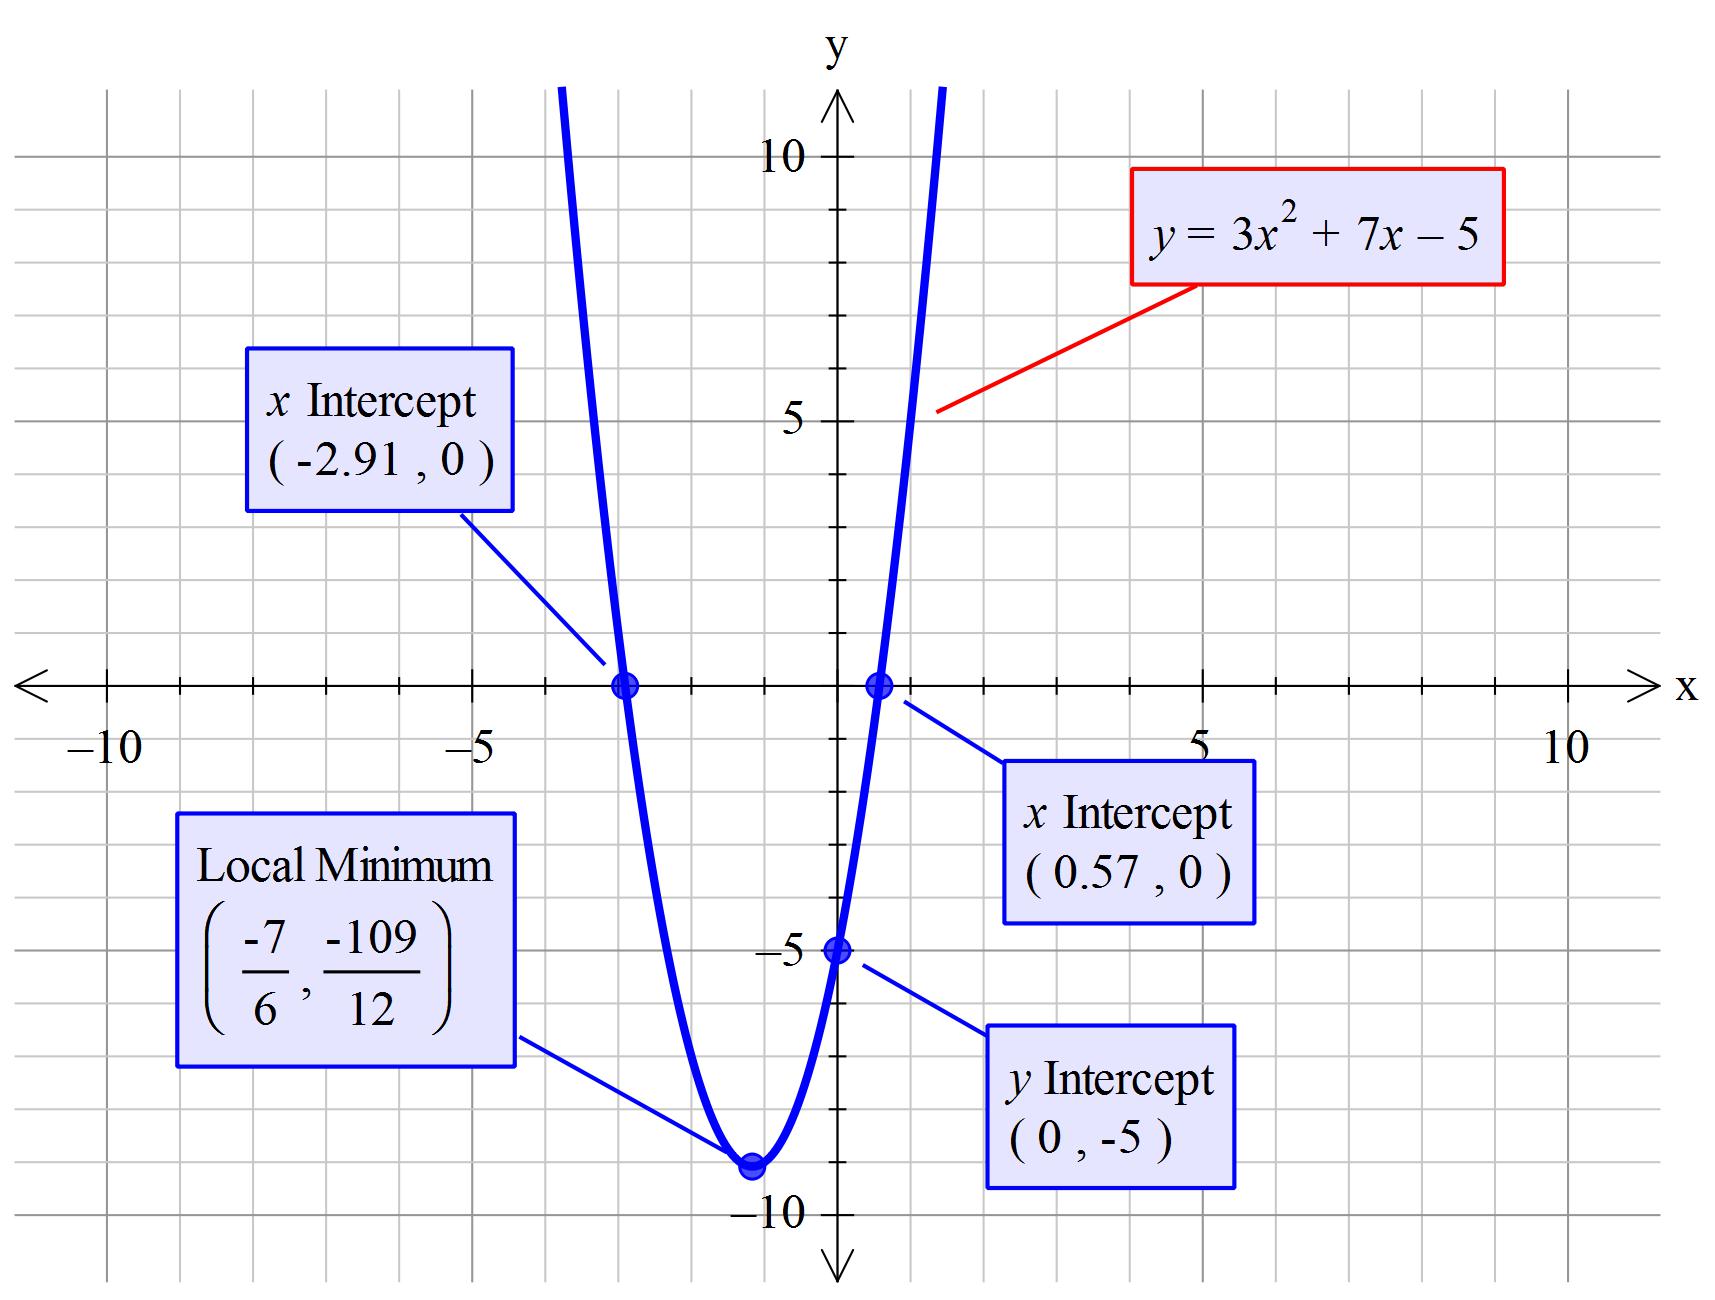
#color(blue)("Point 4: ")#Suppose the equation was #y=3x^2+7x-5#
#" "#it would be prudent to write it as #y=3(x^2+7/3x)-5#
#" "#In this case the #x_("vertex")=(-1/2)xx(7/3) = -7/6#
#" "#Also notice that the #y_("intercept")# is the same as the
#" "#constant of -5.
#color(blue)("Point 5: ")#Suppose we changed the coefficient #x# such that we
#" "#hade #3x^2#. Perhaps the best way of describing its
#" "#effect is to say that it makes the curve narrower. In the
#" "#same, if the coefficient of #x^2# is less than 1 it makes #" "#the graph wider.
#color(blue)("Point 6: ")#To mathematically determine the x intercept set y=0 and
#" "#manipulate the equation. To determine the y intercept #" "#set x=0 and manipulate the equation.
#color(brown)("Compare Point 4 with the graph below")#