For a parabola #ax^2+bx+c#,
the x-coordinate value of the Vertex is given by
#-b/(2a)#
If #a<0#, then the vertex is a maximum value.
If #a>0#, then the vertex is a minimum value.
#color(blue)("Step 1"#
We have
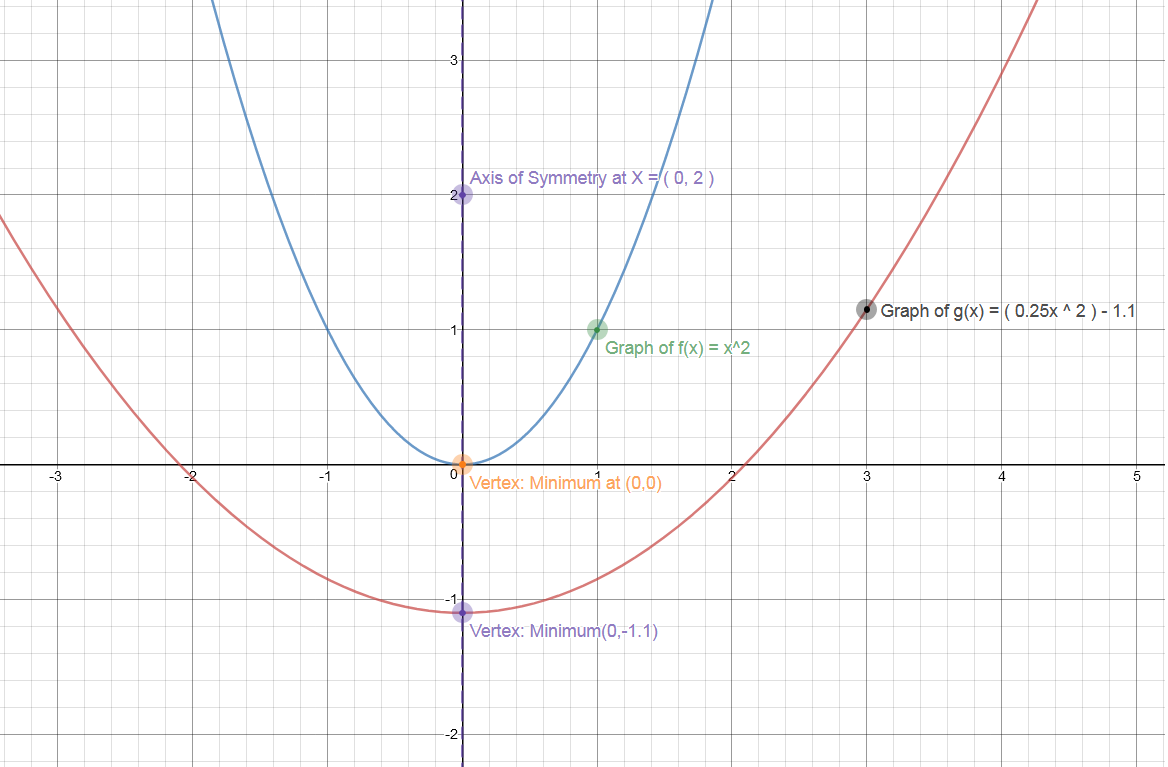
#y=f(x)=x^2#
Hence, #a=1; b=0 and c=0#
x-coordinate of the vertex is #-b/(2a#
#rArr -0/(2*(1)#
#rArr x=0#
To obtain the y-coordinate value of the vertex,
substitute #x=0# in #y=f(x)=x^2#
#y=(0)^2#
#rArr y = 0#
Hence, the vertex of #y=f(x)=x^2# is at #(0,0)#
Since, #a>0#, vertex is a minimum.
#color(blue)("Step 2"#
Next, consider
#y=g(x)=0.25x^2-1.1#
#a=0.25; b=0 and c=-1.1#
x-coordinate of the vertex is #-b/(2a#
#rArr = -0/(2(0.25)#
#x=0#
To obtain the y-coordinate value of the vertex,
substitute #x=0# in #y=g(x)=0.25x^2-1.1#
#y=(0.25)(0^2)-1.1#
#y=-1.1#
Hence, the vertex of #y=g(x)=0.25x^2-1.1# is at #(0,-1.1)#
Since, #a>0#, vertex is a minimum.
#color(blue)("Step 3"#
Next, we will examine the graphs of both #f(x)=x^2# and #g(x)=0.25x^2-1.1#, and compare them.
#y=f(x)=x^2# is the Parent function.
The function #y=f(x)=x^2+b# has a graph with vertex shifted #b# units along the y-axis.
Then the vertex is located at #(0,b)#.
If #b# is positive, then the parabola is translated upwards and, if #b# is negative, it moves downwards.
The parabola, #y=f(x)=ax^2#, is obtained from the parent function #y= f(x)=x^2# by stretching it in the y-direction, away from the x-axis, by a factor of #a#.
Vertex is at #(0,-1,1)#
#color(blue)("Step 4"#
For #g(x)=0.25x^2-1.1#, the arms of the parabola are steeper than those of the parent function.
The y-values of each point on this parabola is #(0.25)# times the y-value of the point on the parent function with the same x-value.
Hence, the graph has been stretched in the y-direction by a factor of #0.25#.

