How is the graph of #g(x)=-12+x^2# related to the graph of #f(x)=x^2#?

2 Answers
Jan 24, 2018

See below.

Explanation:

If we have a function #f(x)=x^2# and add a constant #c# to it .i.e.

#f(x)=x^2+c#

If #c>0#

The curve of #f(x)=x^2# is translated #c# units in the positive #y# direction.

If #c<0#

The curve of #f(x)=x^2# is translated #c# units in the negative #y# direction.

So:

#g(x)=-12+x^2=x^2-12#

#c=-12# #:.# #c<0#

Therefore:

#g(x)=x^2-12color(white)(888)# is:

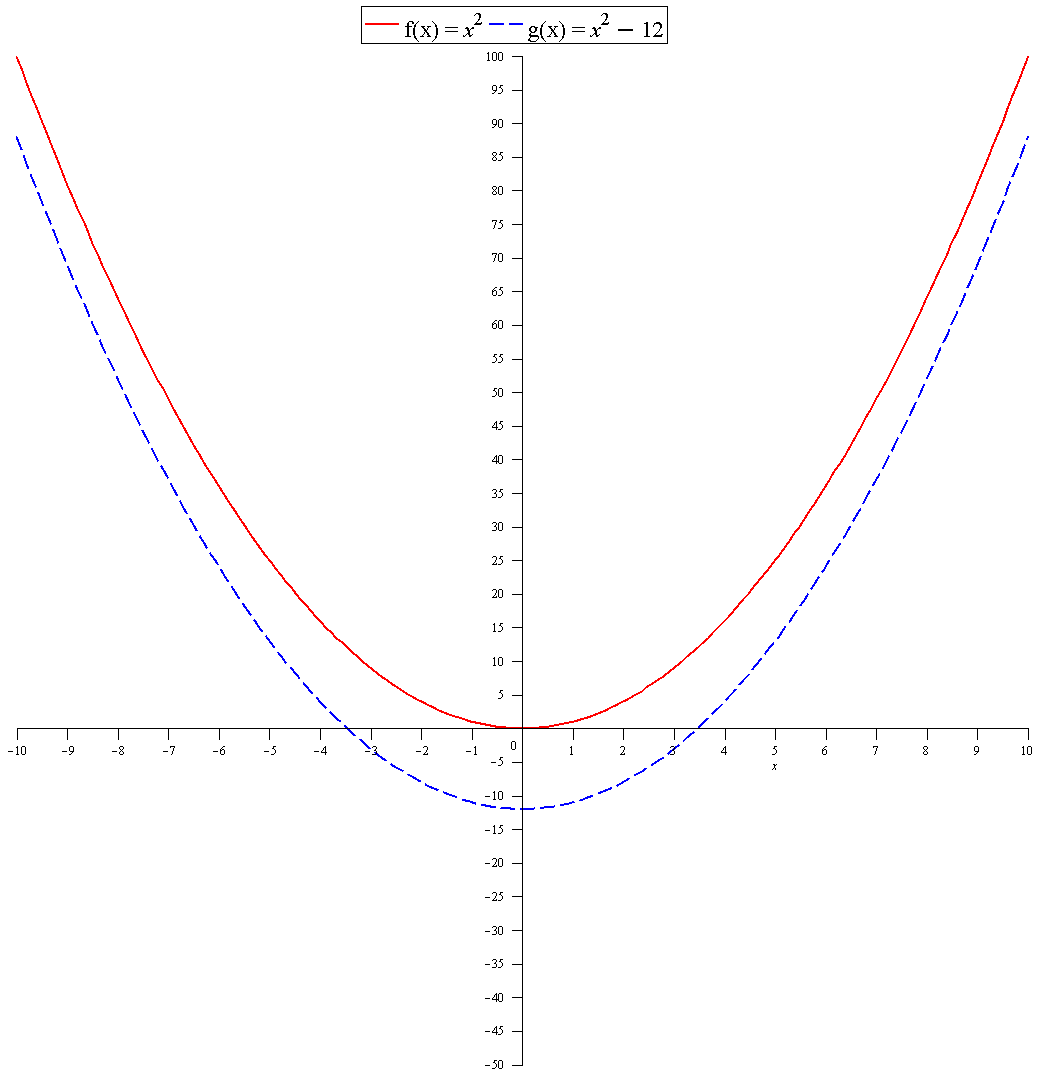
#f(x)=x^2# translated #12# units in the negative y direction.

This is the graph of both #f(x) and g(x)#

enter image source here

Jan 24, 2018

See explanation

Explanation:

You plot the graph of #y=x^2# and lower the whole thing by 12

This is how it works mathematically

In that: given #y_1=x^2" "....................Equation(1)#

Subtract 12 from both sides

#color(green)(color(red)(y_1-12)=x^2-12)" "........................Equation(2)#

Set #color(red)(color(purple)(y_2)=y_1-12)# and substitute into #Eqn(2)# giving

#color(purple)(y_2)color(green)(=x^2-12)" "..............................Equation(2_a)#