How is the graph of #h(x)=-x^2-2# related to the graph of #f(x)=x^2#?
1 Answer

We are given
We need to explain how these graphs are related.
Please read the explanation.
Explanation:
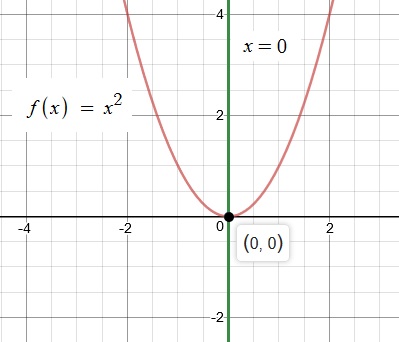
Graph of the Parabola for the Quadratic Equation..
..opens up as the coefficient of
Vertex is at
We have a minimum value for this parabola.
The Vertex is on the Line of Symmetry of the parabola.
Line of Symmetry at x = 0 is the imaginary line where we could fold the image of the parabola and both halves match exactly.
In our problem, this is also the y-axis
Graph
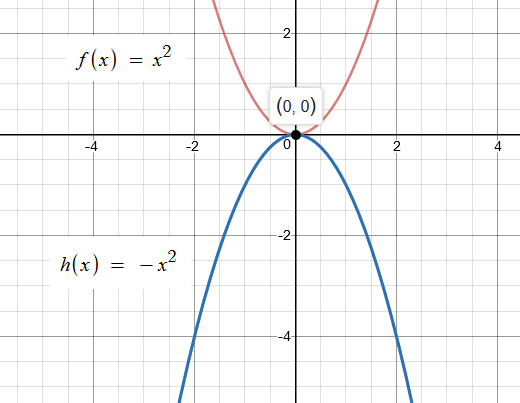
Next, we will consider the equation
For this equation the parabola opens down as the coefficient of
Vertex is at
Line of Symmetry at x = 0
We have a maximum value for this parabola.
This parabola is a reflection of the graph of
Graph
Next we will consider the equation
Vertex is at
Line of Symmetry at x = 0
This parabola is a shift of the graph of
Graph