#" "#
The Vertex Form of a quadratic function is :
#color(blue)(y=f(x)=a(x-h)^2+k#, where #color(green)(( h, k )# is the Vertex of the Parabola.
Quadratic Function is given in Vertex Form: #color(red)(y = (x + 5)^2 - 3#
#color(brown)(h=-5 and k = -3#
Vertex is at #color(green)((h,k)#: #color(blue)((-5, -3)#
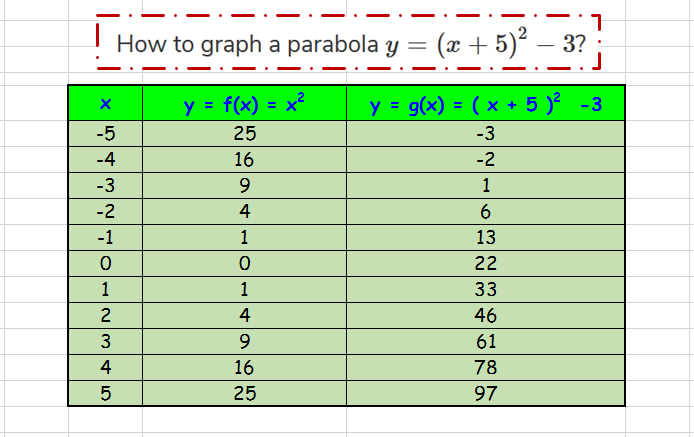
Plot the Vertex and the #color(red)((x,y)# values from the data table.
To find the x-intercepts:
#f(x)=(x+5)^2-3#
Let #f(x)=0#
# :. (x+5)^2-3 = 0#
Add #color(red)(3# to both sides:
#(x+5)^2-3+color(red)(3)= 0+color(red)(3#
#(x+5)^2-cancel 3+color(red)(cancel 3)= 0+color(red)(3#
#(x+5)^2 = 3#
Take Square root on both sides to simplify:
#sqrt((x+5)^2) = sqrt(3)#
#(x+5) = +- sqrt(3)#
Subtract #color(red)(5)# from both sides:
#(x+5)-color(red)(5) = +- sqrt(3)-color(red)(5)#
#(x+cancel 5)-color(red)(cancel 5) = +- sqrt(3)-color(red)(5)#
#x=+-sqrt(3)-5#
Hence, #color(blue)(x=[sqrt(3)-5]# is one solution and #color(blue)(x=[-sqrt(3)-5]# is the other.
Using a calculator,
#color(blue)(x~~ -3.26795)# is one solution.
#color(blue)(x~~ -6.73205)# is another solution.
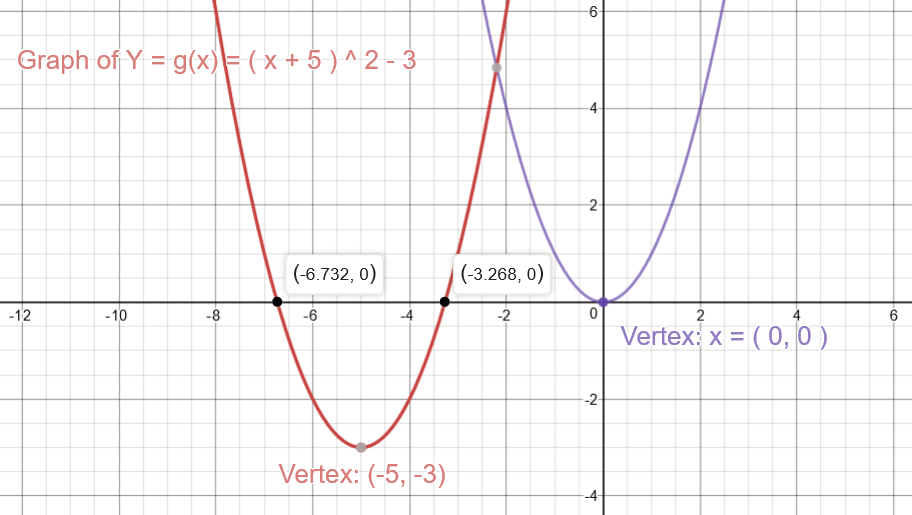
Hence, x-intercepts are: #x~~ -3.3#, #x~~ -6.7#
Verify this solution by using graphs:
#color(green)("Graph 1"#
Graph of #color(blue)(y=x^2#
This is the Parent Graph.
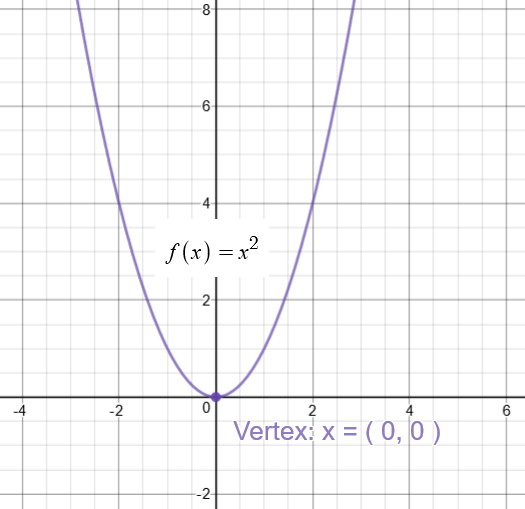
Use this graph to understand the behavior of the given quadratic function.
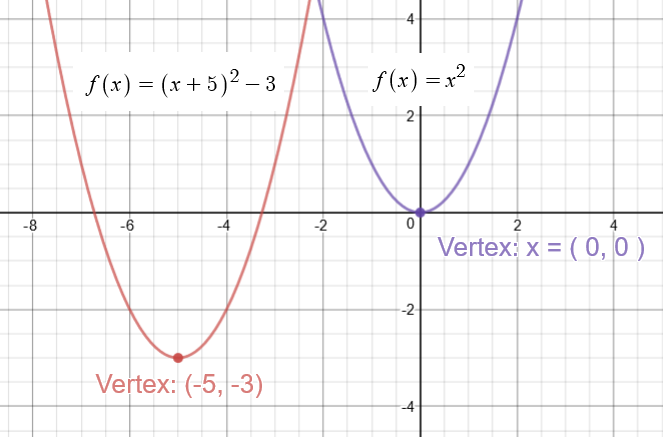
#color(green)("Graph 2"#
Graph of #color(blue)(y = (x + 5)^2 - 3#
Study the graphs of both the Parent function and the given function.
Next, verify the x-intercepts:
Hope it helps.

