How would I graph x > -2 on a coordinate plane?

1 Answer
Apr 9, 2018

Please see below.

Explanation:

The equation #x = -2# has a graph that is a vertical line with all #x#-coordinates equal to #-2#.
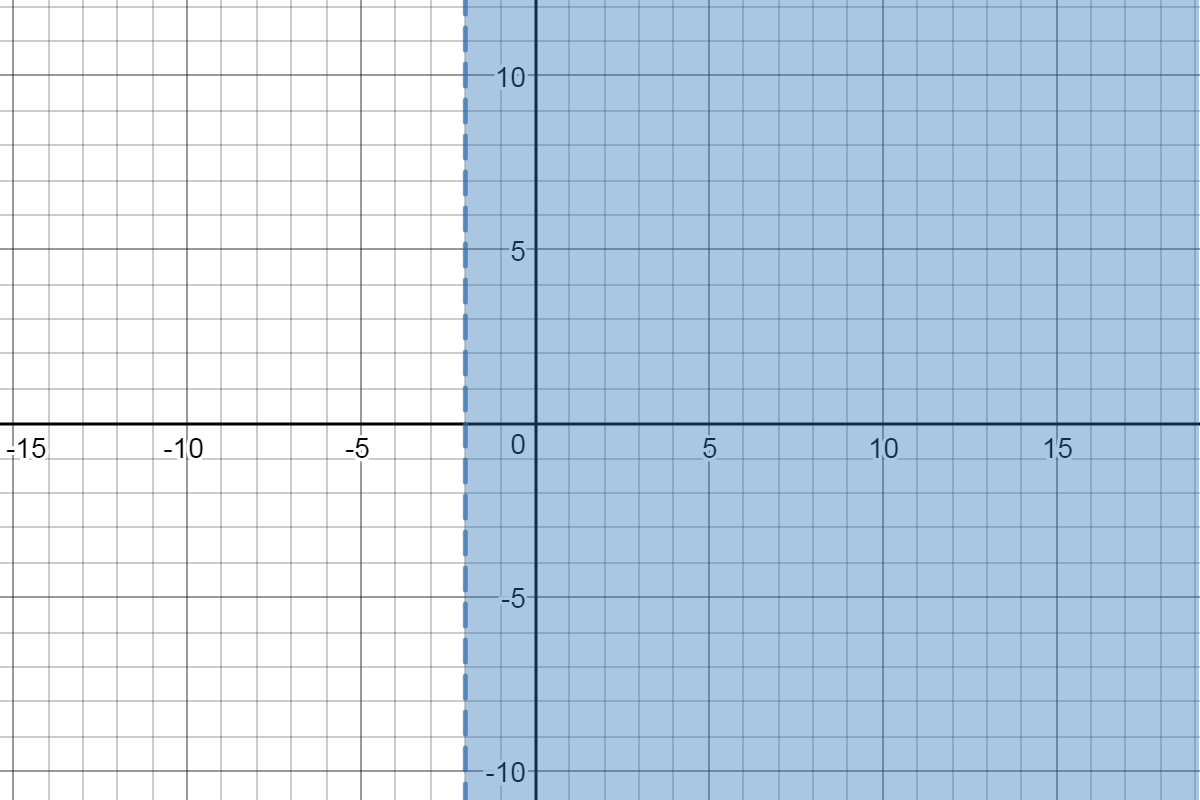
The collection of points with #x#-coordinate (strictly) greater that #-2# is to the right of this line.
The graph of the inequality is shaded in blue. The vertical line #x=-2# is dashed rather than solid to indicate that the line is not included.

enter image source here