You could approximate and use:
#e~~3# and use easy values for #x# to get your points. If you use this option the graph will not be perfect but you'll show that you can plot the graph. You need to specify clearly that you used this approximation so that everyone knows.
On the other hand you could be asked to use the value of #e=2.7183# to plot your graph.
I would again simplify a bit using #e=2.72# also because if you draw your graph by hand you'll not need many decimals, difficult to be plotted anyway.
Then I would use "friendly" #x# values, such as:
#x=1# so #g(1)=e^(1-1)=e^(0)=1#
#x=2# so #g(2)=e^(2-1)=e=2.72#
#x=3# so #g(3)=e^(3-1)=e^2=2.72*2.72=7.3984~~7.4#
This last one can be done by hand quite rapidly.
you can even try #x=4# so #g(4)=e^(4-1)=e^3=e^2*e~~20# again doing it by hand on paper (although probably quite difficult to fit into your graph).
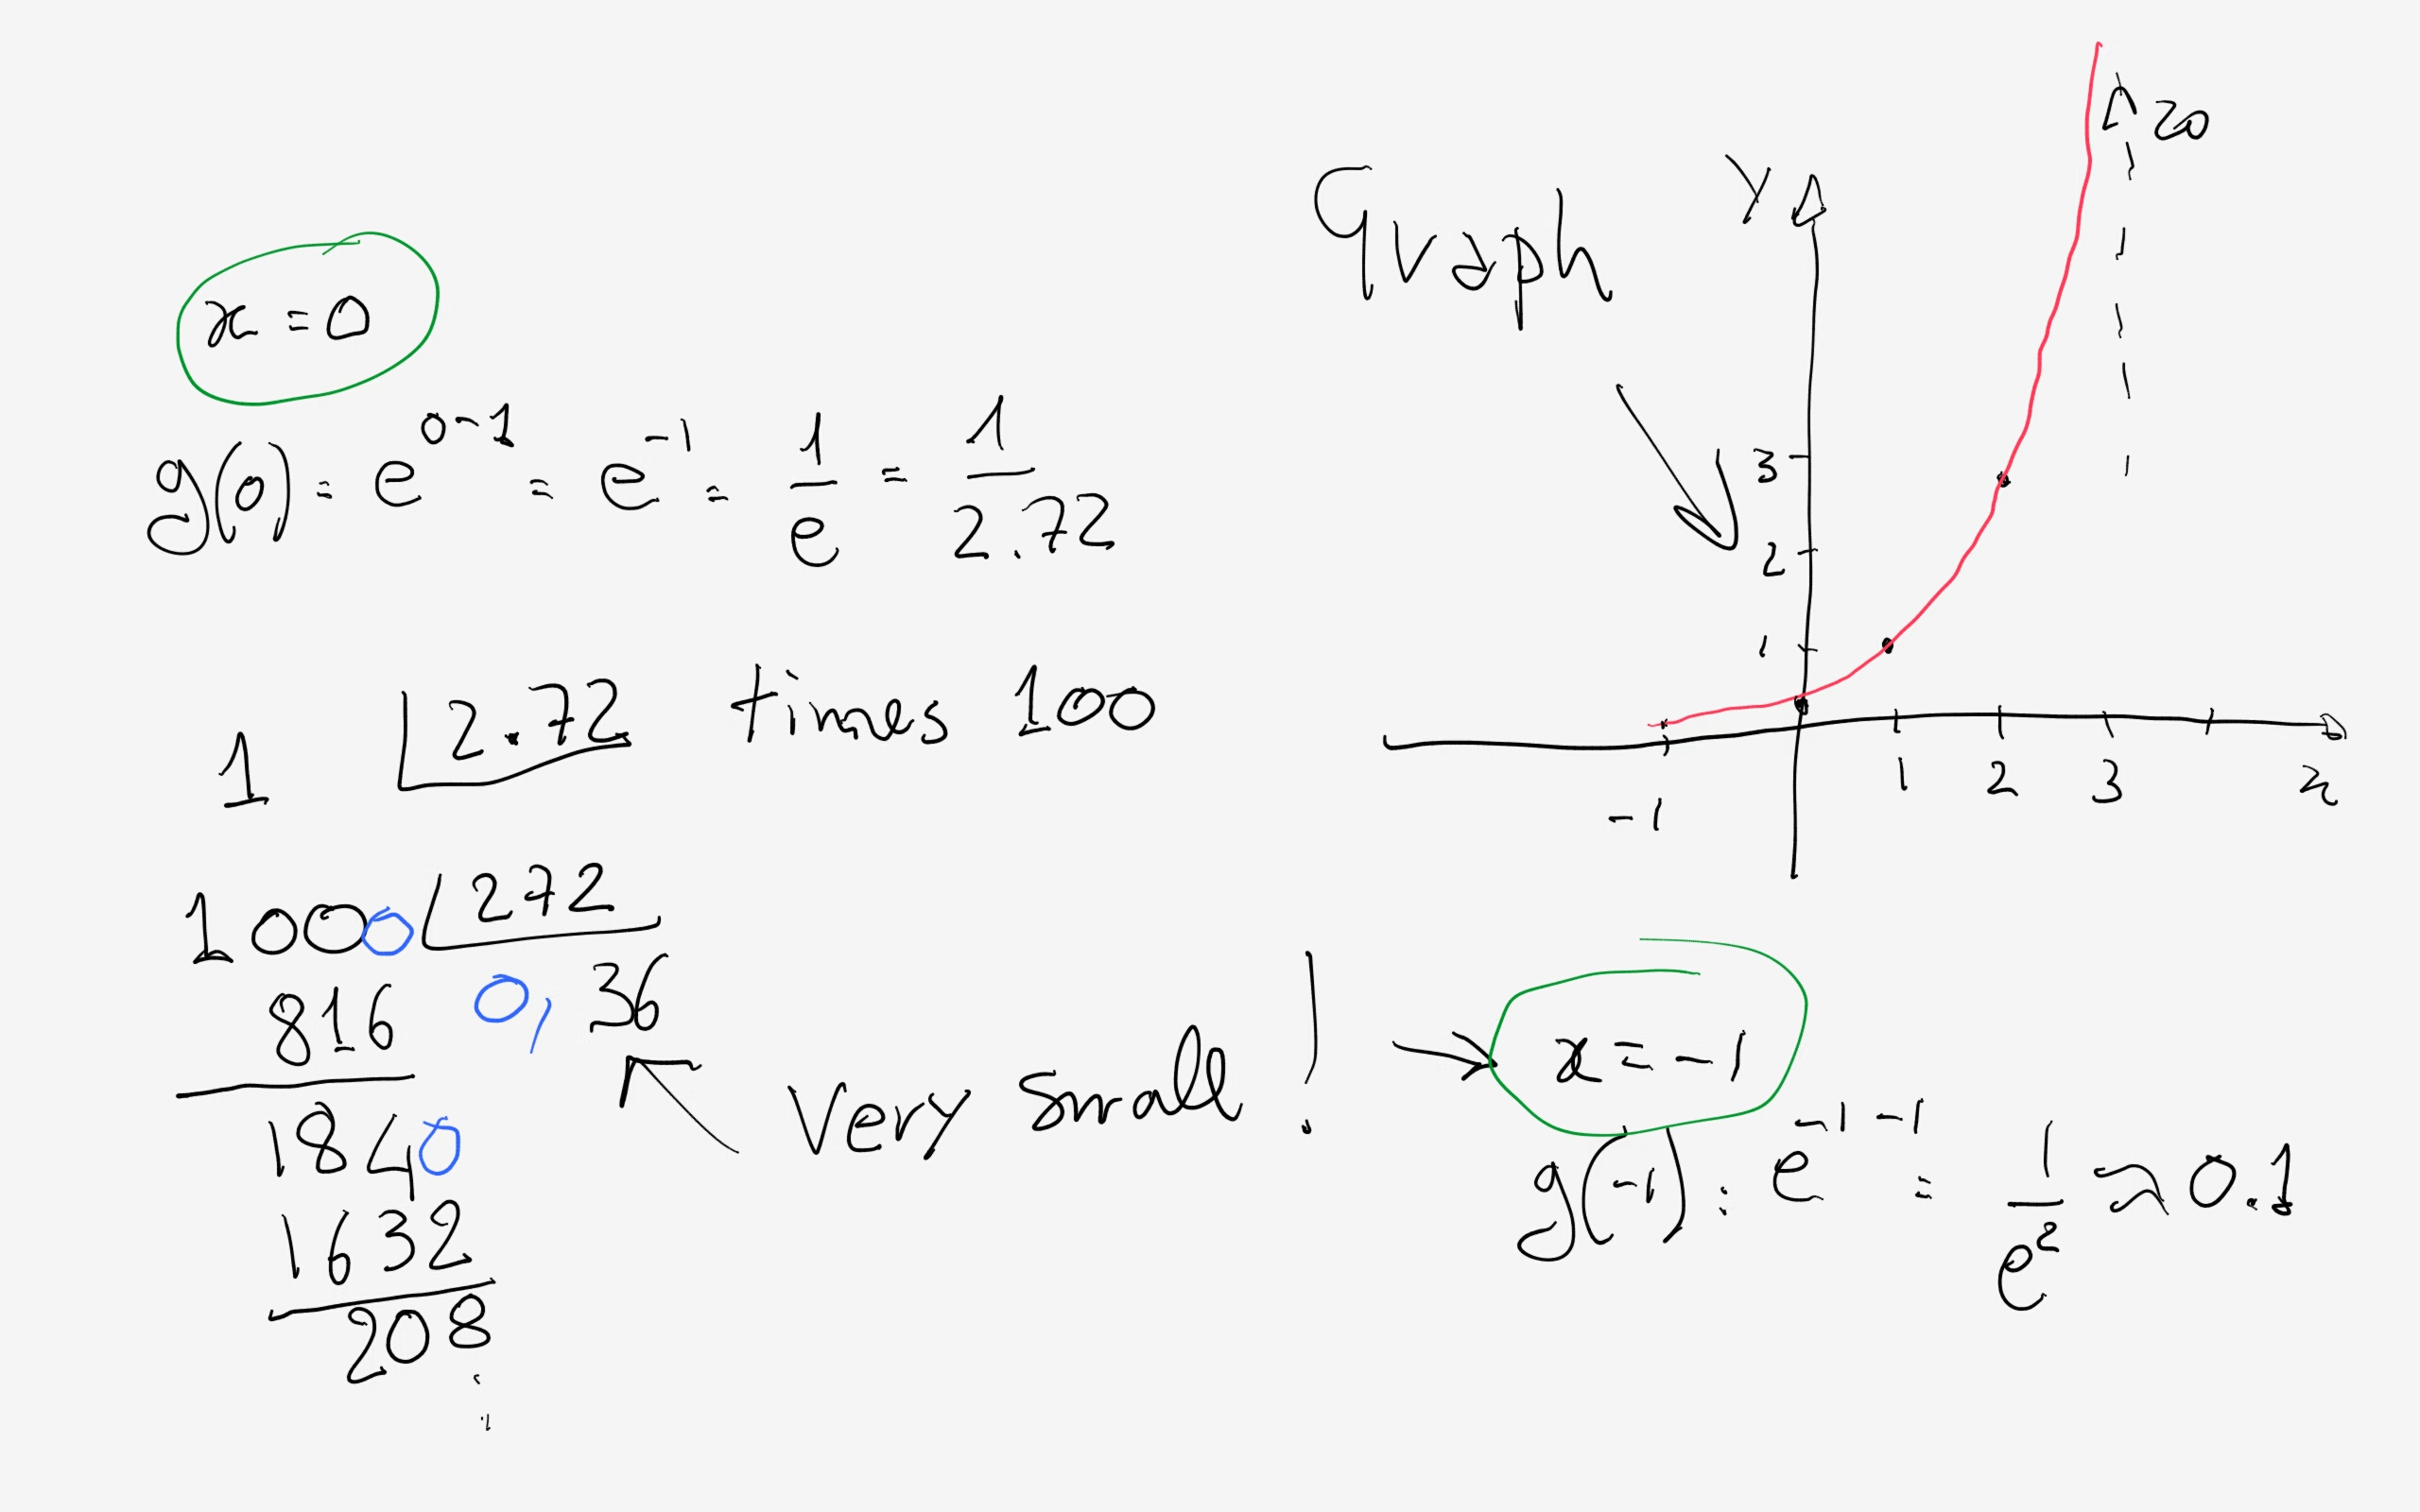
it would be nice to have points at, say, #x=0# and #x=-1#; try this: