How does the range of a function relate to its graph?
1 Answer

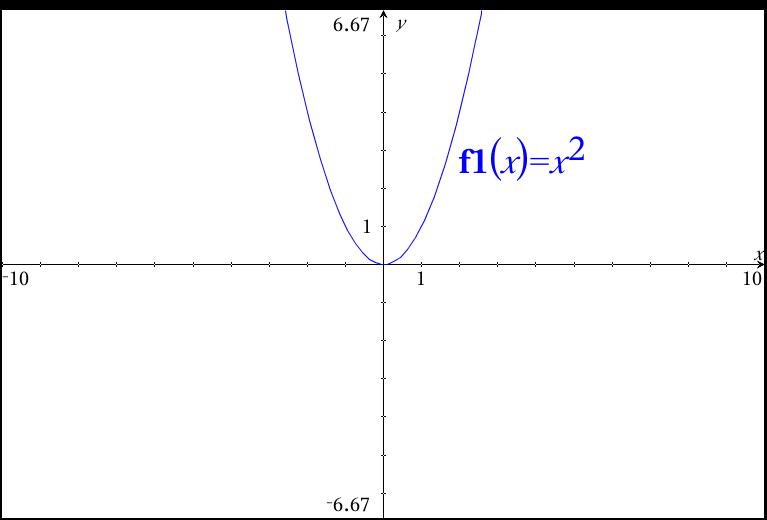
The range of a function is its y-values or outputs. If you look at the graph from lowest point to highest point, that will be the range.
Ex:
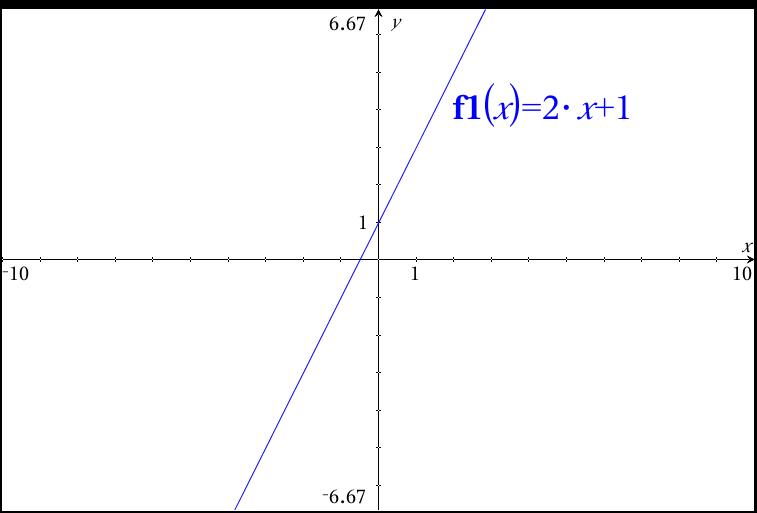
Ex: y = 2x + 1 has a range from
In interval notation, you would write
Ex: Some functions have interesting ranges like the sine function.
y = sin(x) 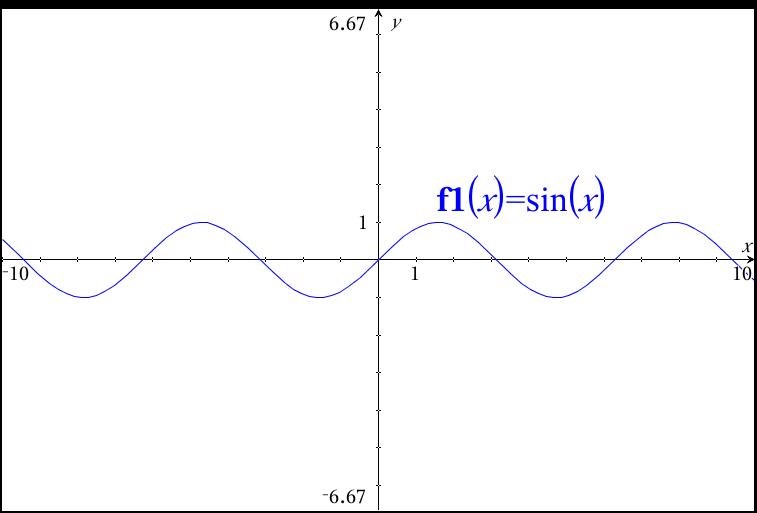
Its highest values are 1 and its lowest values are -1. That range is
Ex: A rather complicated function with a very challenging range is the inverse or reciprocal function,
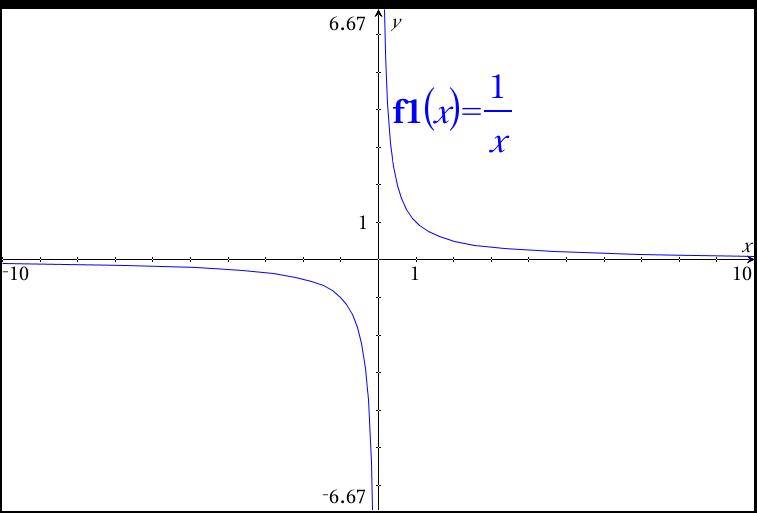
The output values might be difficult to describe except to say that they seem to include all real numbers except 0. (there is a horizontal asymptote on the x-axis)
You could write
Enjoy your study of range!
