How do you draw a box-and-whisker plot for the following unordered data. 49, 57, 53, 54, 49, 67, 51, 57, 56, 59, 57, 50, 49, 52, 53, 50, 58?
1 Answer

Nov 3, 2014
By rearranging them in ascending order,
49,49,49,50,50,51,52,53,53,56,54,57,57,57,58,59,67
So, the smallest is 49, the median
For the first half:
49,49,49,50,50,51,52,53,
the median
For the second half:
56,54,57,57,57,58,59,67,
the median
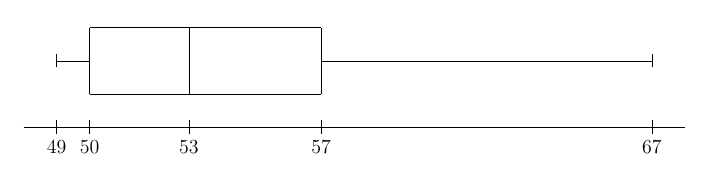
The box-and-whisker plot looks like:
I hope that this was helpful.
