How do you translate graphs of square root functions?
1 Answer
In order to translate any function to the right or left, place an addition or subtraction "inside" of the Parent function. In the case of the square root function, it would look like y =
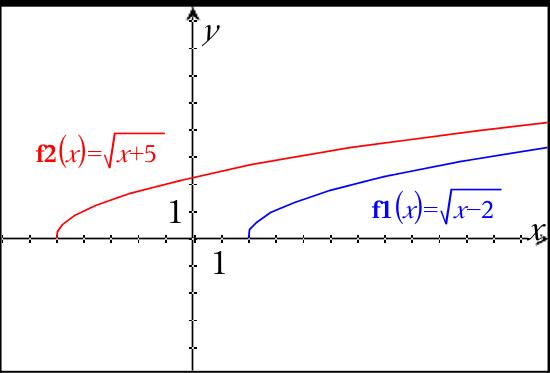
Let's look at the effect of the addition or subtraction. First, the domain will be altered. You must set x - 2
This implies a horizontal shift/translation of 2 units to the right. (see graph)
Now repeat for x + 5

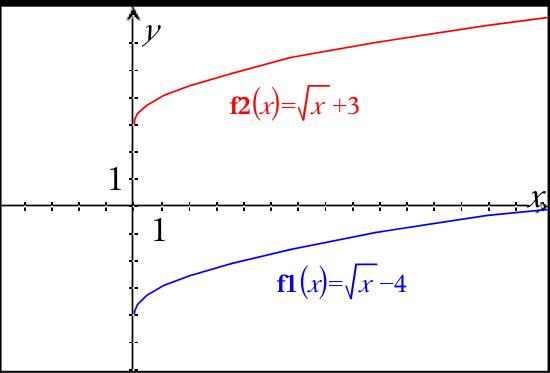
Now, let's explore how to translate a square root function vertically. y =

If you are ready for a challenge, we can try to translate in more than one direction at a time!
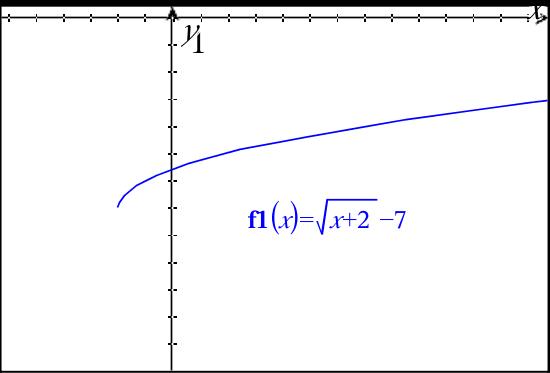
y =
Find the domain by setting x + 2
And, subtraction of 7, must mean down 7. (see graph)


