How do you graph systems of inequalities?

1 Answer
Apr 4, 2015

When we say #y < 1#, it means all points on the coordinate plane which its #y#-axis is smaller than #1#.

Similarly, if we say #y < x#, we will mark every point on the coordinate plane whose #y# is smaller than its #x#.

If there are two inequalities, each of them will mark some points on the coordinate plane. But some of the points on the coordinate plane will be marked by both of them. This means, those points are satisfying both of the inequalities so those points are our solution set.

Example

#y < x# and #y>=x-2#

To graph #y < x# we will use a base line which is #y=x# for this one.

We will graph #y=x# first. But since #y < x# doesn't mark the points which #x=y#, we will graph a dashed line. A dashed line means the points on that line are not included in the solution set.

Then, the coordinate plane will be divided in two parts by the line. Now select a random point from each part.

Lets say #A(1,2)# and #B(1,0)#.

Lets test these points with #y < x# to see which one will satisfy it.

#A: 2<1# incorrect

#B: 0<1# correct

So the points at the part where #B# lies are satisfying this inequality; they are marked (shaded).

graph{y < x [-10, 10, -5, 5]}

Now lets continue with #y >= x-2#

We will use the base line #y=x-2#. Since the inequality tells #y=x-2# is in the range, the line will be a solid line.

Then we will select #2# random points from each part of the coordinate plane:

#C(0,0)# and #D(0,-4)#

Test them:

#C: 0>=-2# correct

#D: -4>=-2# incorrect

So the points at the part where #C# lies are satisfying this inequality; they are marked (shaded).

graph{y>=x-2 [-10, 10, -5, 5]}

Now you'll see the intersection of the shaded areas. Shade it with another color and thats it.
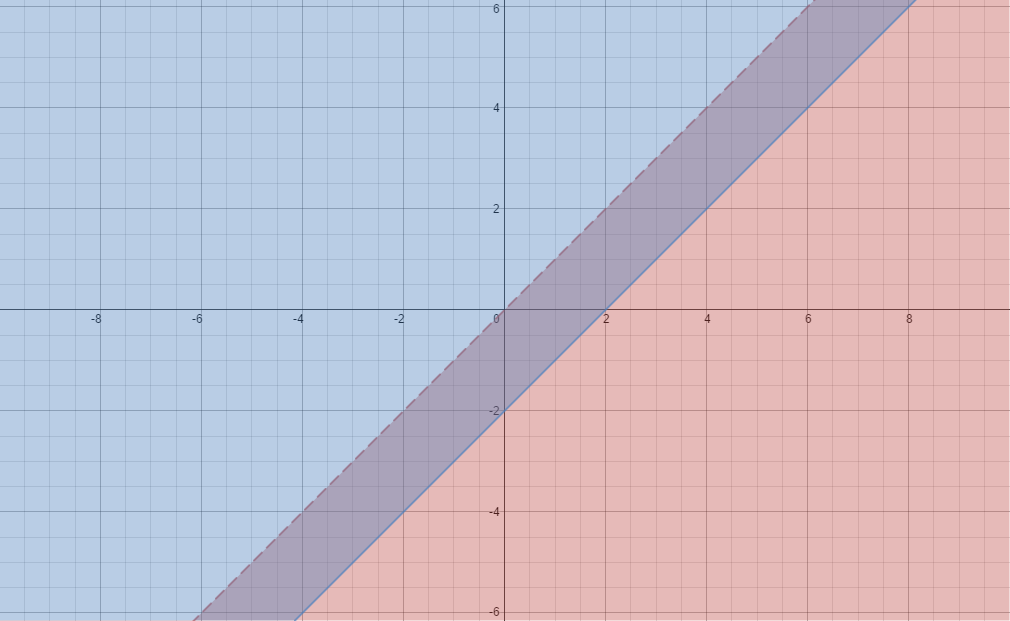
enter image source here