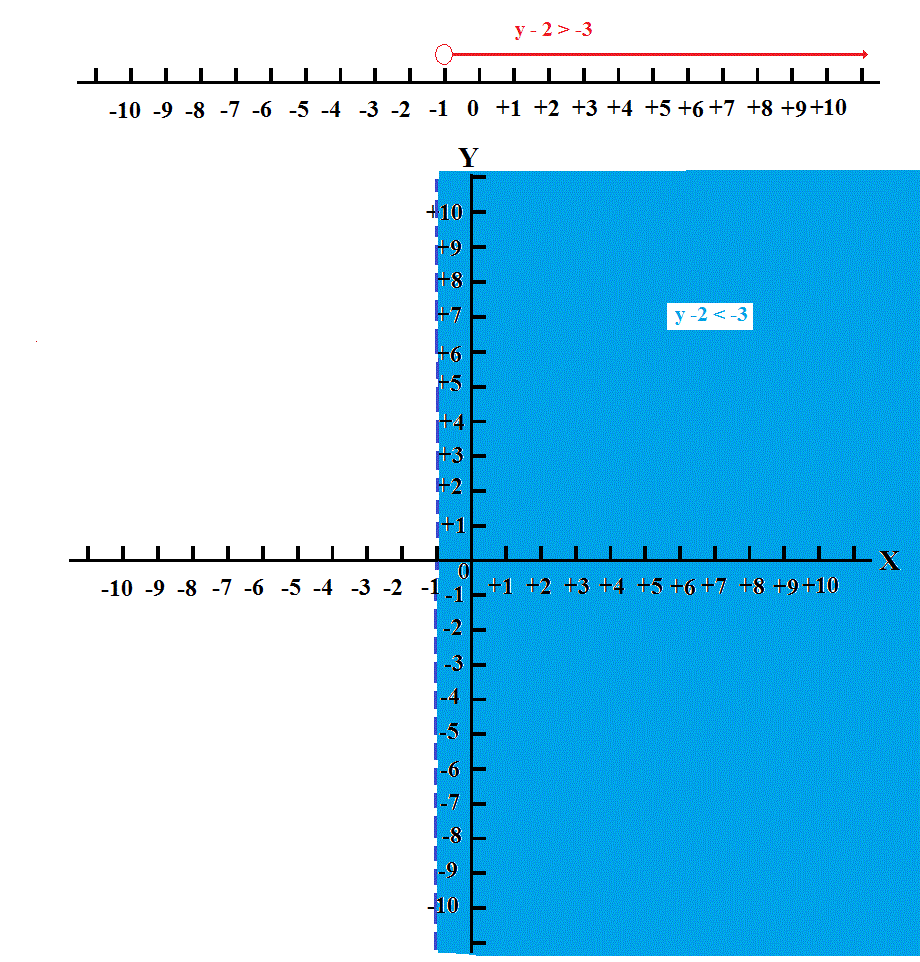
How do you solve and graph #y - 2 > -3#?
1 Answer
Jul 23, 2015
Explanation:
Given an inequality, the following operations can be performed to both sides of the inequality without effecting the inequality relation:
- Add any amount
- Subtract any amount
- Multiply by any amount
#> 0# - Divided by any amount
#> 0#
Given
We can add
Since this is a relationship involving a single variable, it could be graphed on a number line (top image below); notice the hollow circle which indicates that the value
You could also graph this relationship on the Cartesian plane (bottom image below); again, notice the broken line on the left indicates that

