How do you graph #x + y < 3# and #x – y < 4#?
1 Answer

Find the intercepts and asymptotes, plot a few points, and then sketch the graph.
Explanation:
Step 1. Find the domain and range.
Step 2. Find the
Let
The
Step 3. Find the
There is no
Step 4. Find the horizontal asymptote.
As
The horizontal asymptote is at
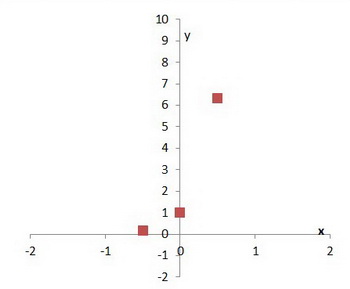
Step 5. Calculate some extra points.
We have one point:
Step 6. Plot the axes and your three points.
Step 7. Complete the graph with a smooth curve through the three points.
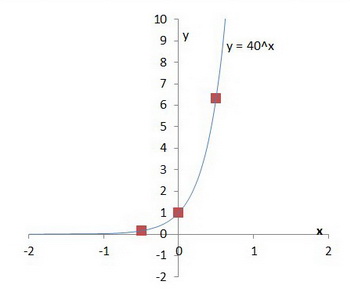
And you have your graph.
