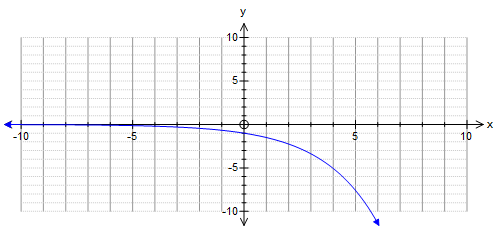
How do you graph #g(x) = -(3/2)^x#?
1 Answer
Actual graph plot shown. Explanation following it!
Explanation:
It is a good thing if you are able to interpret the expression/equation in such a way that you build up a mental picture of what the numbers are actually doing. The structure of an equation is modelling behaviour in some way. First the graph:

Clarifying a point:
IN this case the process is given the name of "g".
Hence
To be able to graph this we have to include the consequence of that operation which is a value. This is the dependant variable and when we "equate" this to
Look at the overall structure of the equation. It is
The absolute value of the number that the operation is carried out on is a is "bigger" than 1 ( absolute value means that it has been converted to positive). So if multiplied by itself repeatedly it gets bigger and bigger.
But this number will always be negative so its value as
Note that less than 0 does not necessarily mean smaller.
By the way; when
or another way of saying it:
when
When
in which case as

