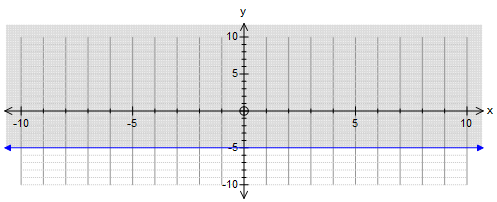
How do you graph the inequality #y≥ -5#?
1 Answer
Oct 30, 2015
You shade the area on the graph that is above the line y=5
See explanation
Explanation:

The sine that looks like
It is a bit like the equals sign in an equation but with an extra 'twist' to it!

