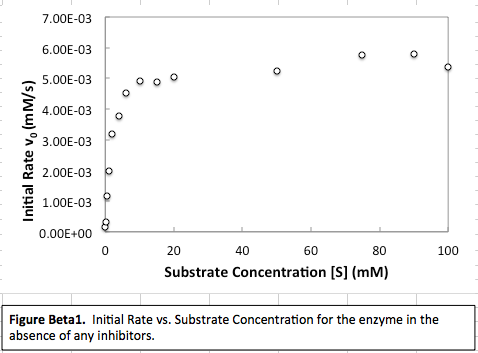
How do you look at a #v_0# vs. #[S]# curve (#S = "substrate"#) to find the first-order and zero-order regions? How do you find #v_(max)# and #K_M# from this curve?
1 Answer
A first order reaction is dependent on the initial concentration of the substrate, but a zero order reaction is independent of the concentration of the substrate.
One relationship that is useful is:
#v_"max"/2 = K_M = (k_(-1) + k_2)/(k_1)# where
#v_"max" = k_2[E]_"total"# and#K_M# is the Michaelis constant that approximates the binding affinity (but is NOT the same as#K_D# !!!).
We have three possible cases to consider. First, let's see what this

CASE I (small substrate concentration)
If you recall the Michaelis-Menten equation, you now get:
#(k_2[E]_"total"[S])/(cancel([S]) + K_M) = color(blue)(k_2/K_M[E]_"total"[S])# where
#k_2/K_M# gives you the efficiency of enzyme catalysis.
This is the far left of the graph. In this case, because there is little substrate, it is difficult to find. When that is the case, the rate of reaction is highly dependent on how quickly the enzyme can find the substrate, and a higher initial concentration of the substrate promotes easier finding. Therefore, this is a "first order" region.
CASE II (substrate concentration equals
In this case, you get:
#(k_2[E]_"total"cancel([S]))/(2cancel([S])) = k_2/2[E]_"total"#
#= color(blue)((v_"max")/2)#
This is near where
CASE III (high substrate concentration)
And in this third case, you get:
#(k_2[E]_"total"cancel([S]))/(cancel([S]) + cancel(K_M)) = k_2[E]_"total"#
#= color(blue)(v_"max")#
This is the far right of the graph. In this case, there is a lot of substrate, and so it is easy for the enzyme to find the substrate. Therefore, the rate is limited by how quickly the enzyme can act, and the concentration of the substrate becomes insignificant to affecting the rate. Therefore, this can be considered the "zero order" region.

