Where does the maximum electron density occur for 2s and 2p orbitals in hydrogen atom?

1 Answer
Dec 28, 2015

For hydrogen, we have to use spherical harmonics, so our dimensions are written as #(r, theta, phi)#. The wave function is defined as follows, via separation of variables:

#color(green)(psi_(nlm_l)(r,theta,phi) = R_(nl)(r) Y_(l)^(m_l)(theta, phi))#

#R_(nl)(r)# is the radial component of the wave function #psi_(nlm_l)(r,theta,phi)#, #Y_(l)^(m_l)(theta,phi)# is the angular component, #n# is the principal quantum number, #l# is the angular momentum quantum number, and #m_l# is the projection of the angular momentum quantum number (i.e. #0, pm l#). The wave function represents an orbital.

If you don't understand all of that, that's fine; it was just for context.

To get the maximum electron density, you have to look at probability density curves.

If we plot #4pir^2R_(nl)(r)^2# against #r#, we get the probability density curves for an atomic orbital.

The #2s# orbital's plot looks like this:

http://chemwiki.ucdavis.edu/

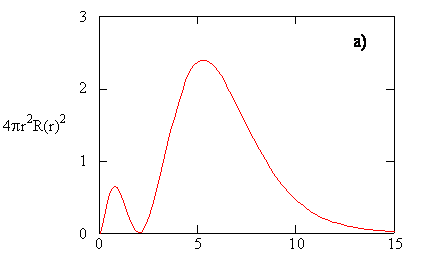
From this, you can tell that the maximum electron density occurs near #5a_0# (with #a_0 ~~ 5.29177xx10^(-11) "m"#, the Bohr radius) from the center of the atom, and #4pir^2 R_(20)(r)^2# is about #2.45# or so.

From this similar diagram, we can compare the #2s# with the #2p# orbital:

http://faculty.uml.edu/

Here, you should see that the #2p# orbital has a maximum electron density near about #4a_0# from the center of the atom, and the value of #4pir^2 R_(21)(r)^2# is perhaps around #2.5#.

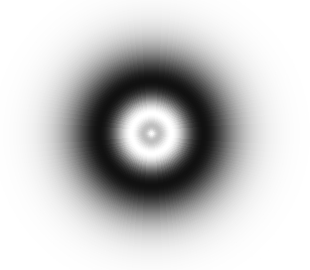
This should make more sense once you realize what the probability density plots of the #2s# and #2p# orbitals look like:

2s
http://cronodon.com/

2p
http://cronodon.com/

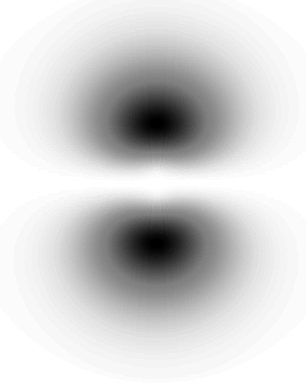
"The density of the [dark spots] is proportional to the probability of finding the electron in that region" (McQuarrie, Ch. 6-6).

Basically, start with a radius of 0, and expand your radius of vision outwards from the center of the orbital, and you should be constructing the probability density curves (radial distribution plots).