How would you graph #f(x)= 2 ln x#?
1 Answer

Jan 21, 2016
See the explanantion
Explanation:
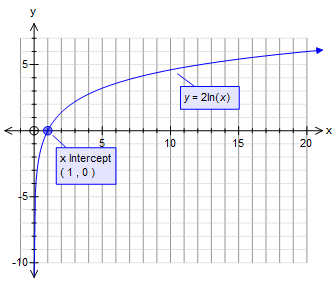
To find the x-intercept mathematically
If
Another way of writing this is:
The x-intercept is when
So the x-intercept is at
'~~~~~~~~~~~~~~~~~~~~~~~~~~~~~~~~~~~~~~~~~~~~
You asked 'how' would you graph ....
The method would be to build a table of values.
The top row would have the values of x
The next row down would have the values of ln(x)
and the row below that would have the values of
This last row gives the values for
You would then mark a series of points that maches both your value of
Your graph should look something like this: