What is the graph of the system #2x+3y>6# and #-x+y<-4#?
1 Answer

Mar 16, 2016
It is explained below
Explanation:
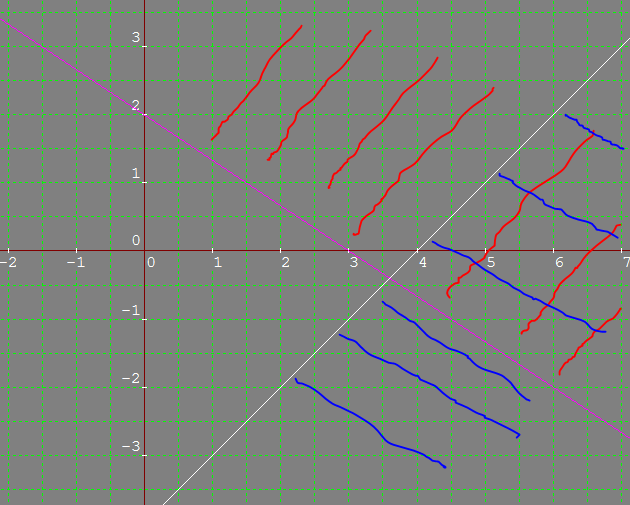
First graph the equations 2x+3y=6 (Line in pink color) and -x+y=-4(Line in white color) , as usual. Make both the lines dotted to signify the inequalities.
Now the region 2x+3y>6 would be the one shaded in red in the picture below. The region -x+y<-4 would be the one shaded in blue. Hence the region common to both would be the required graph.