How do you plot the Arrhenius equation?
1 Answer

You draw a graph of
Explanation:
The Arrhenius equation is
where
#k# is the rate constant#A# is the pre-exponential factor#E_a# is the activation energy#R# is the universal gas constant#T# is the temperature
If we take the logarithms of both sides, we get
or
This is the equation of a straight line
where
By comparing the equations, we see that the slope of the line is
Hence, if we draw a graph of
Example
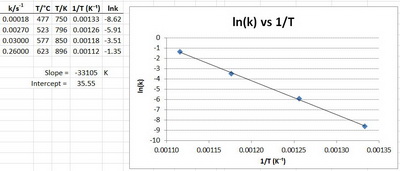
For a certain reaction, the data were:
Plot the Arrhenius equation using the above values.
Solution
We have to plot
We must convert the temperatures to kelvins and take their reciprocals.
We must also take the natural logarithms of the rate constants.
Although we could do this by hand, I find it easier to do the calculations and the plot in Excel.
Here's are my results.