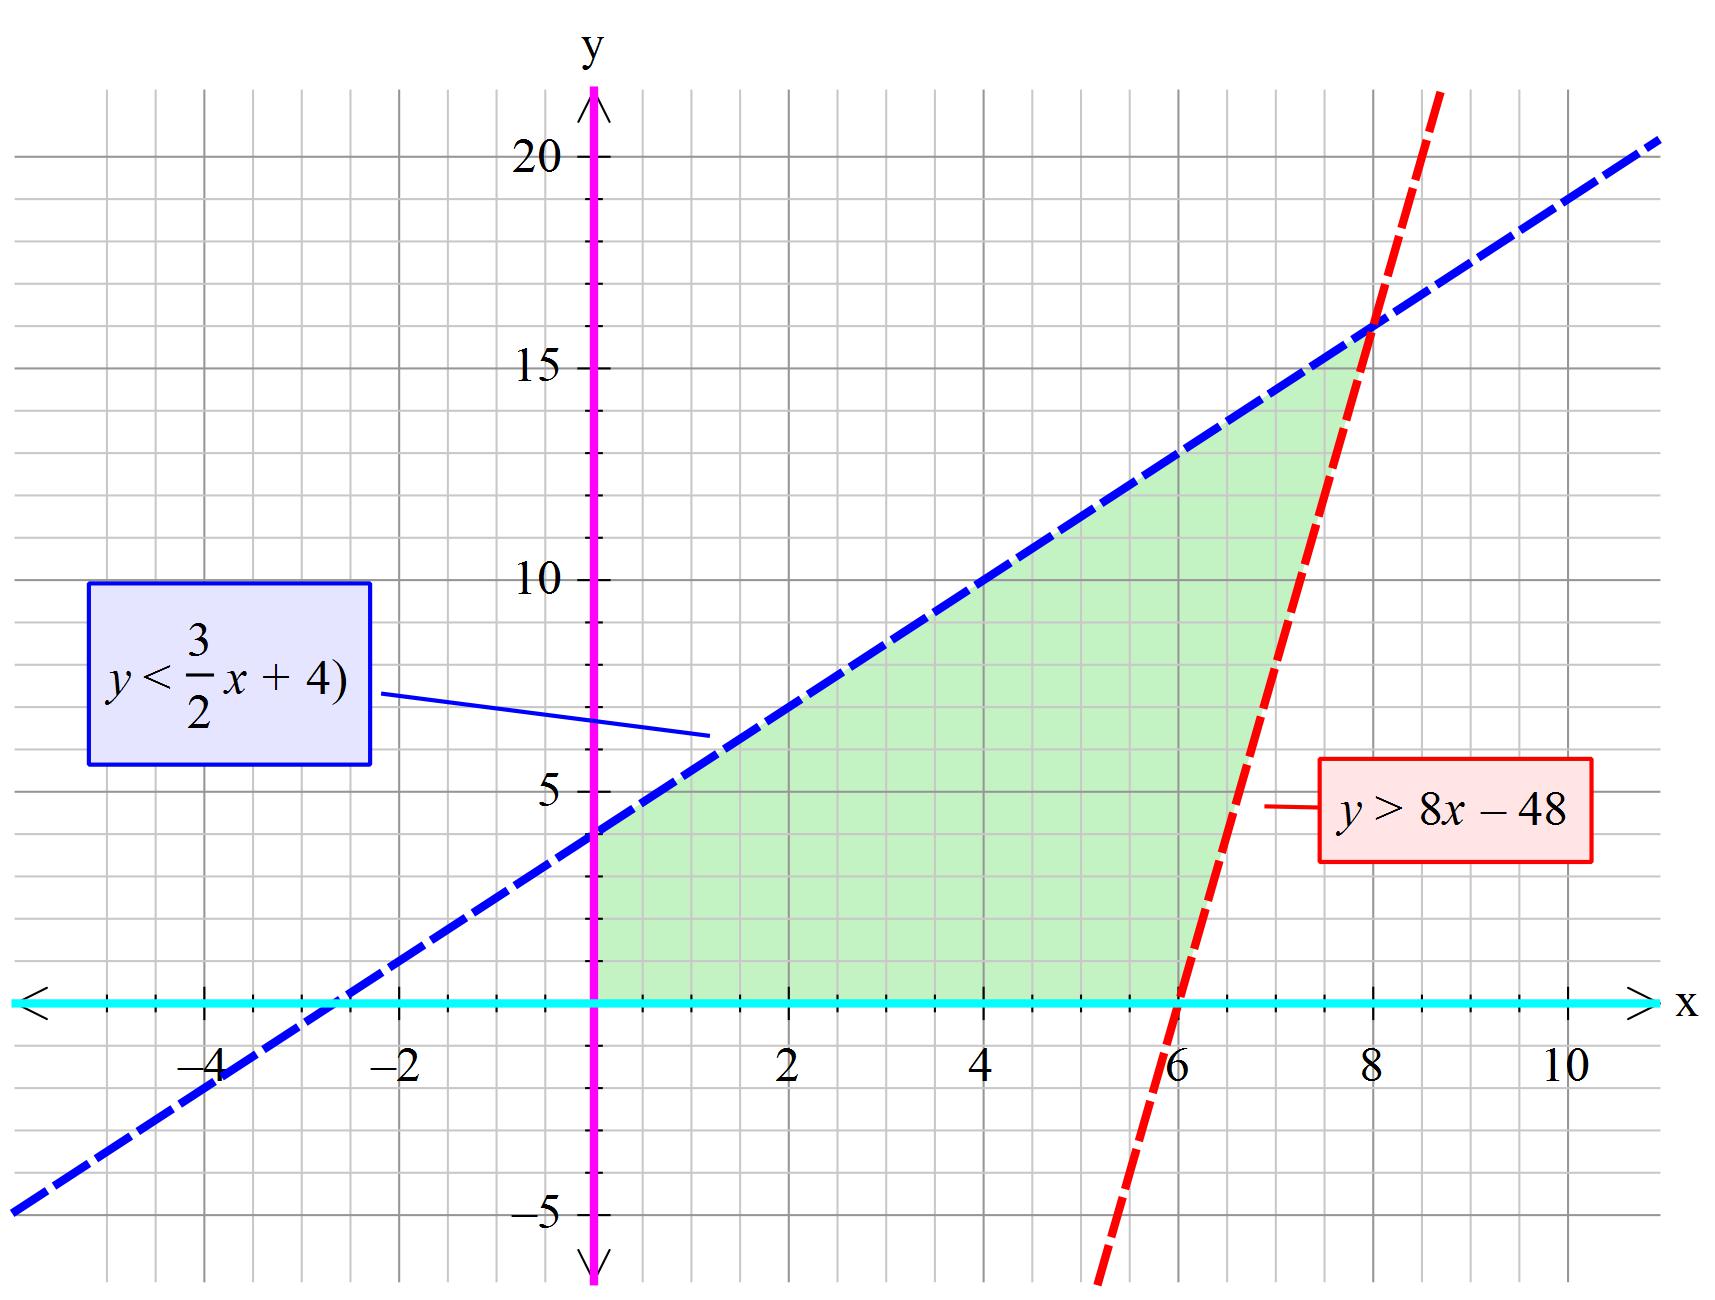
How do you graph the inequality #-3x+2y<8#, #-8x+y> -48#, #x>=0#, #y>=0#?
1 Answer
Mar 29, 2016
See explanation
Explanation:
Change the first to inequalities such that y is the dependant variable. Calculate the points for

The shaded area is the condition that all 4 are true.

