How do you graph the inequality x<3?
1 Answer

Apr 6, 2016
The graph below shows the inequality
Explanation:
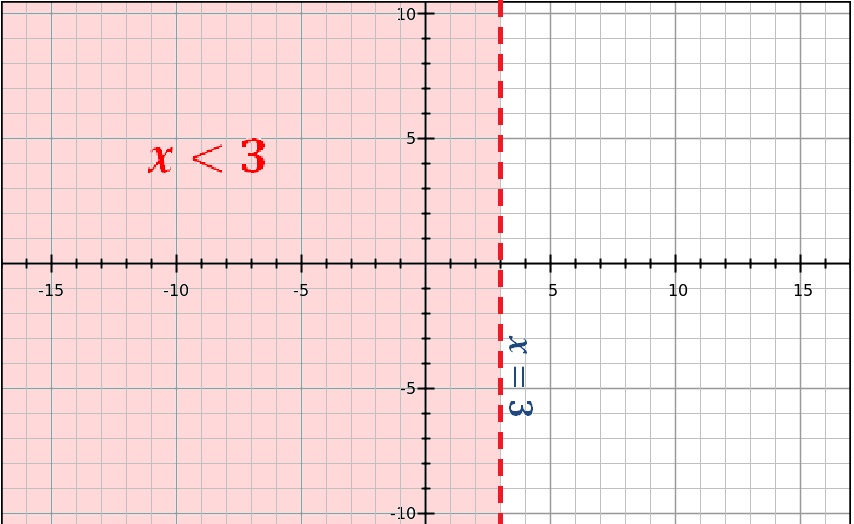
All points that lie in the shaded area satisfy the equation
In other words,
Since there is strict inequality, i.e.,
Therefore, a dotted line is used to mark
