How do you graph #y=4x#?
3 Answers

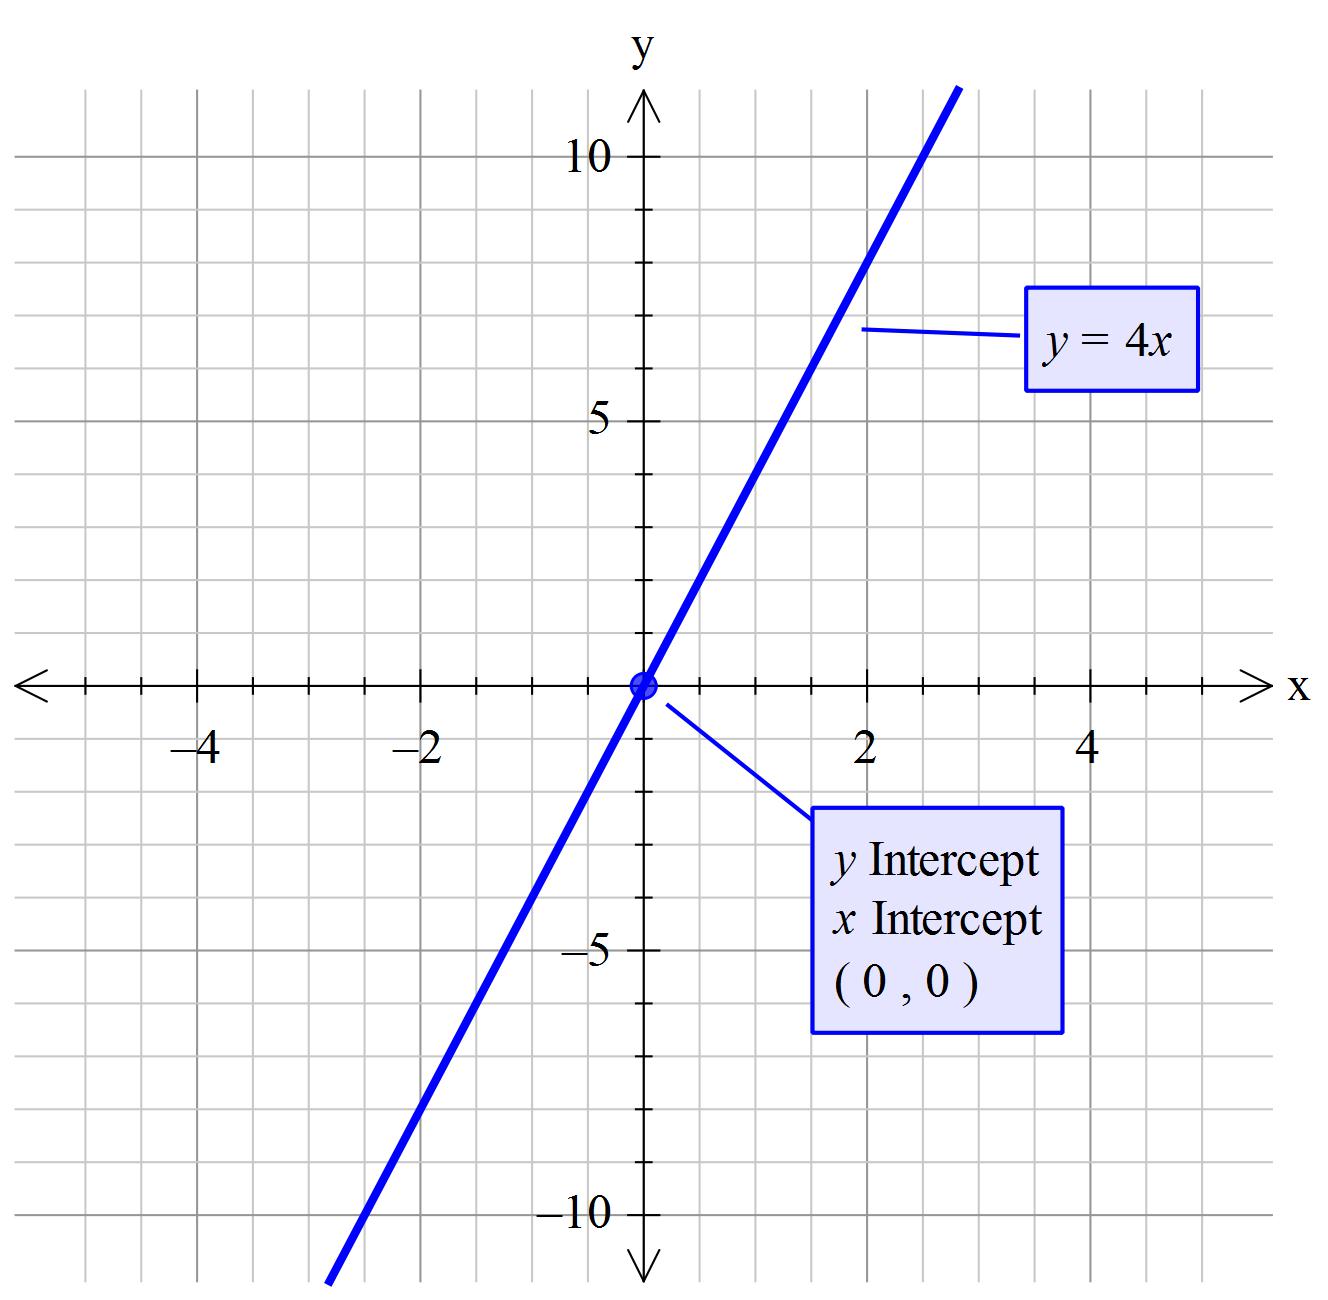
graph{y=4x [-10, 10, -5, 5]}
Explanation:
Graph
First, determine your slope and y-intercept.
(Your equation is in slope-intercept form)
Slope-intercept Form:
In your equation, the slope is
Because your
graph{y=4x [-10, 10, -5, 5]}

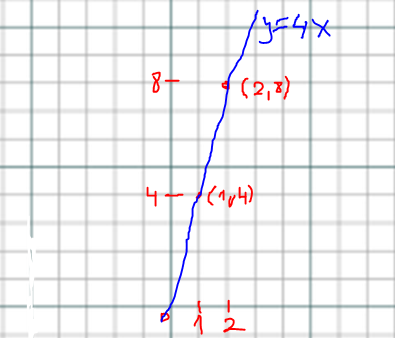
Take for x any two numbers. Let the x be 1 and 2.
So, according to the equation the results for the y would be as follows:
#
enter image source here

Explanation:
The number in front of the
The value of 4 is really
If the number in front of the x (coefficient) is positive the 'slope' goes up. If the coefficient is negative it means the 'slope' is down.
For this question; substitute any value you chose into
'~~~~~~~~~~~~~~~~~~~~~~~~~~~~~~~~~~
Let
At
So this can be our first point on the graph.
'~~~~~~~~~~~~~~~~~~~~~~~~~~~~~~~~~~~
Choosing a number at random: I chose 2
Let
At
So this can be our second point on the graph.
'~~~~~~~~~~~~~~~~~~~~~~~~~~~~~~
Note that gradient
'~~~~~~~~~~~~~~~~~~~~~~~~~~~~~~~~
Mark your two points on the graph paper. Draw a line through them extending it to the edges of the axis.
The label could read something like:
"graph of
