How do you graph #ln(4-x)#?
1 Answer

May 30, 2016
Dee explanantion
Explanation:
set
Build a table listing a selection of positive and negative values for
For each value of
Mark the
I usually use Excel to build table examples but for some reason it is not working.
Do not forget that if
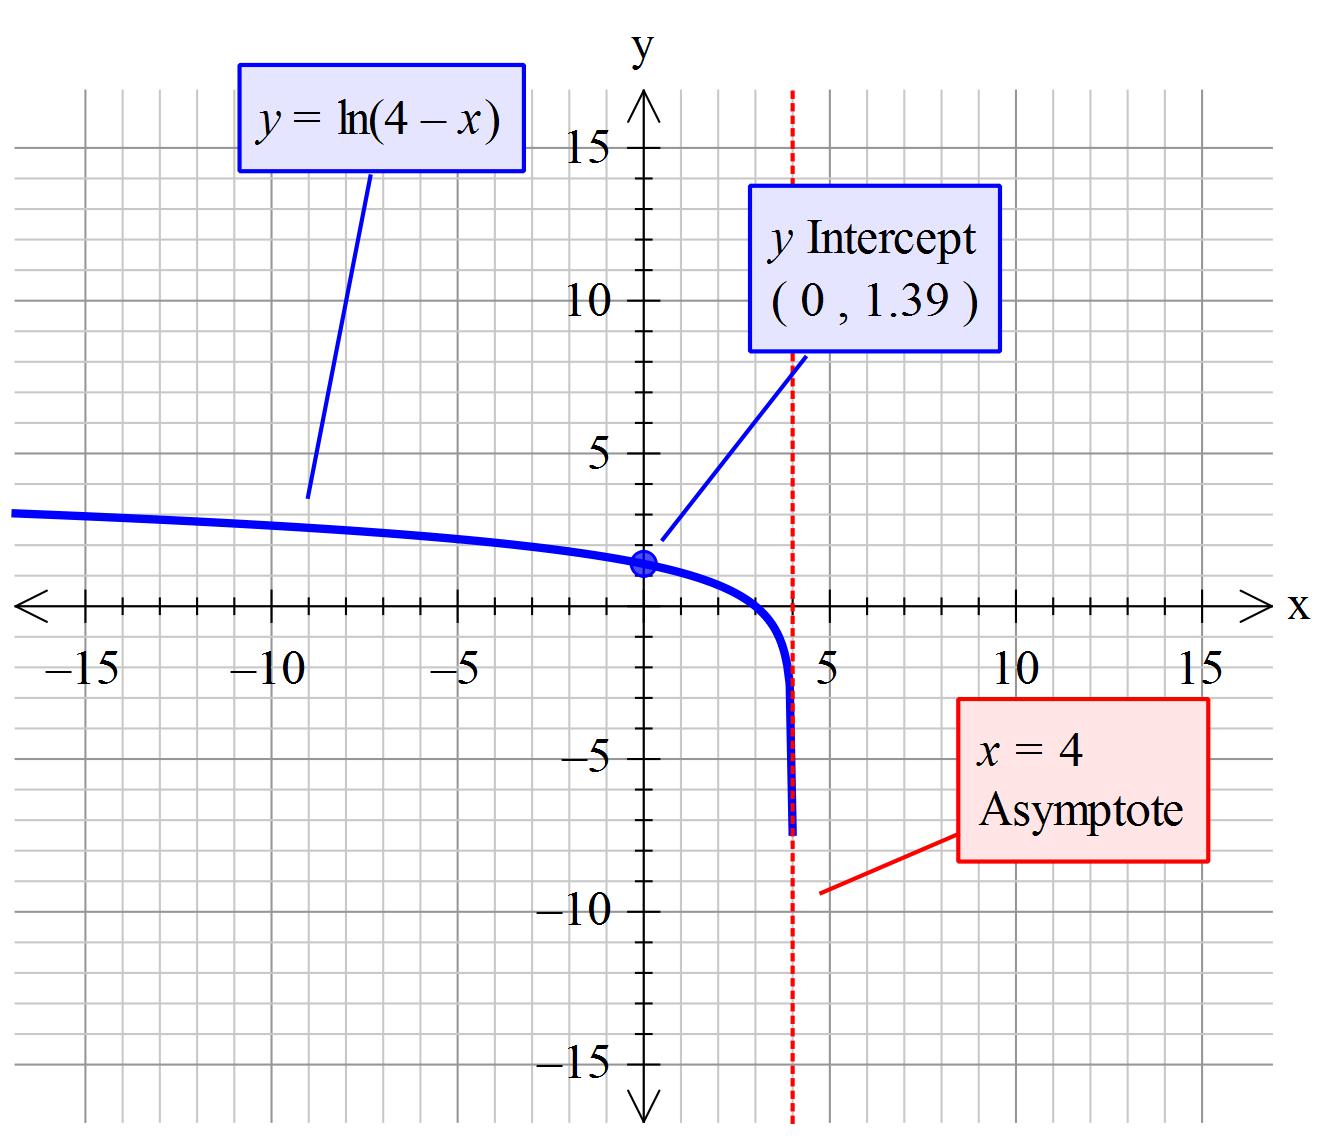
Your graph should look something like this: