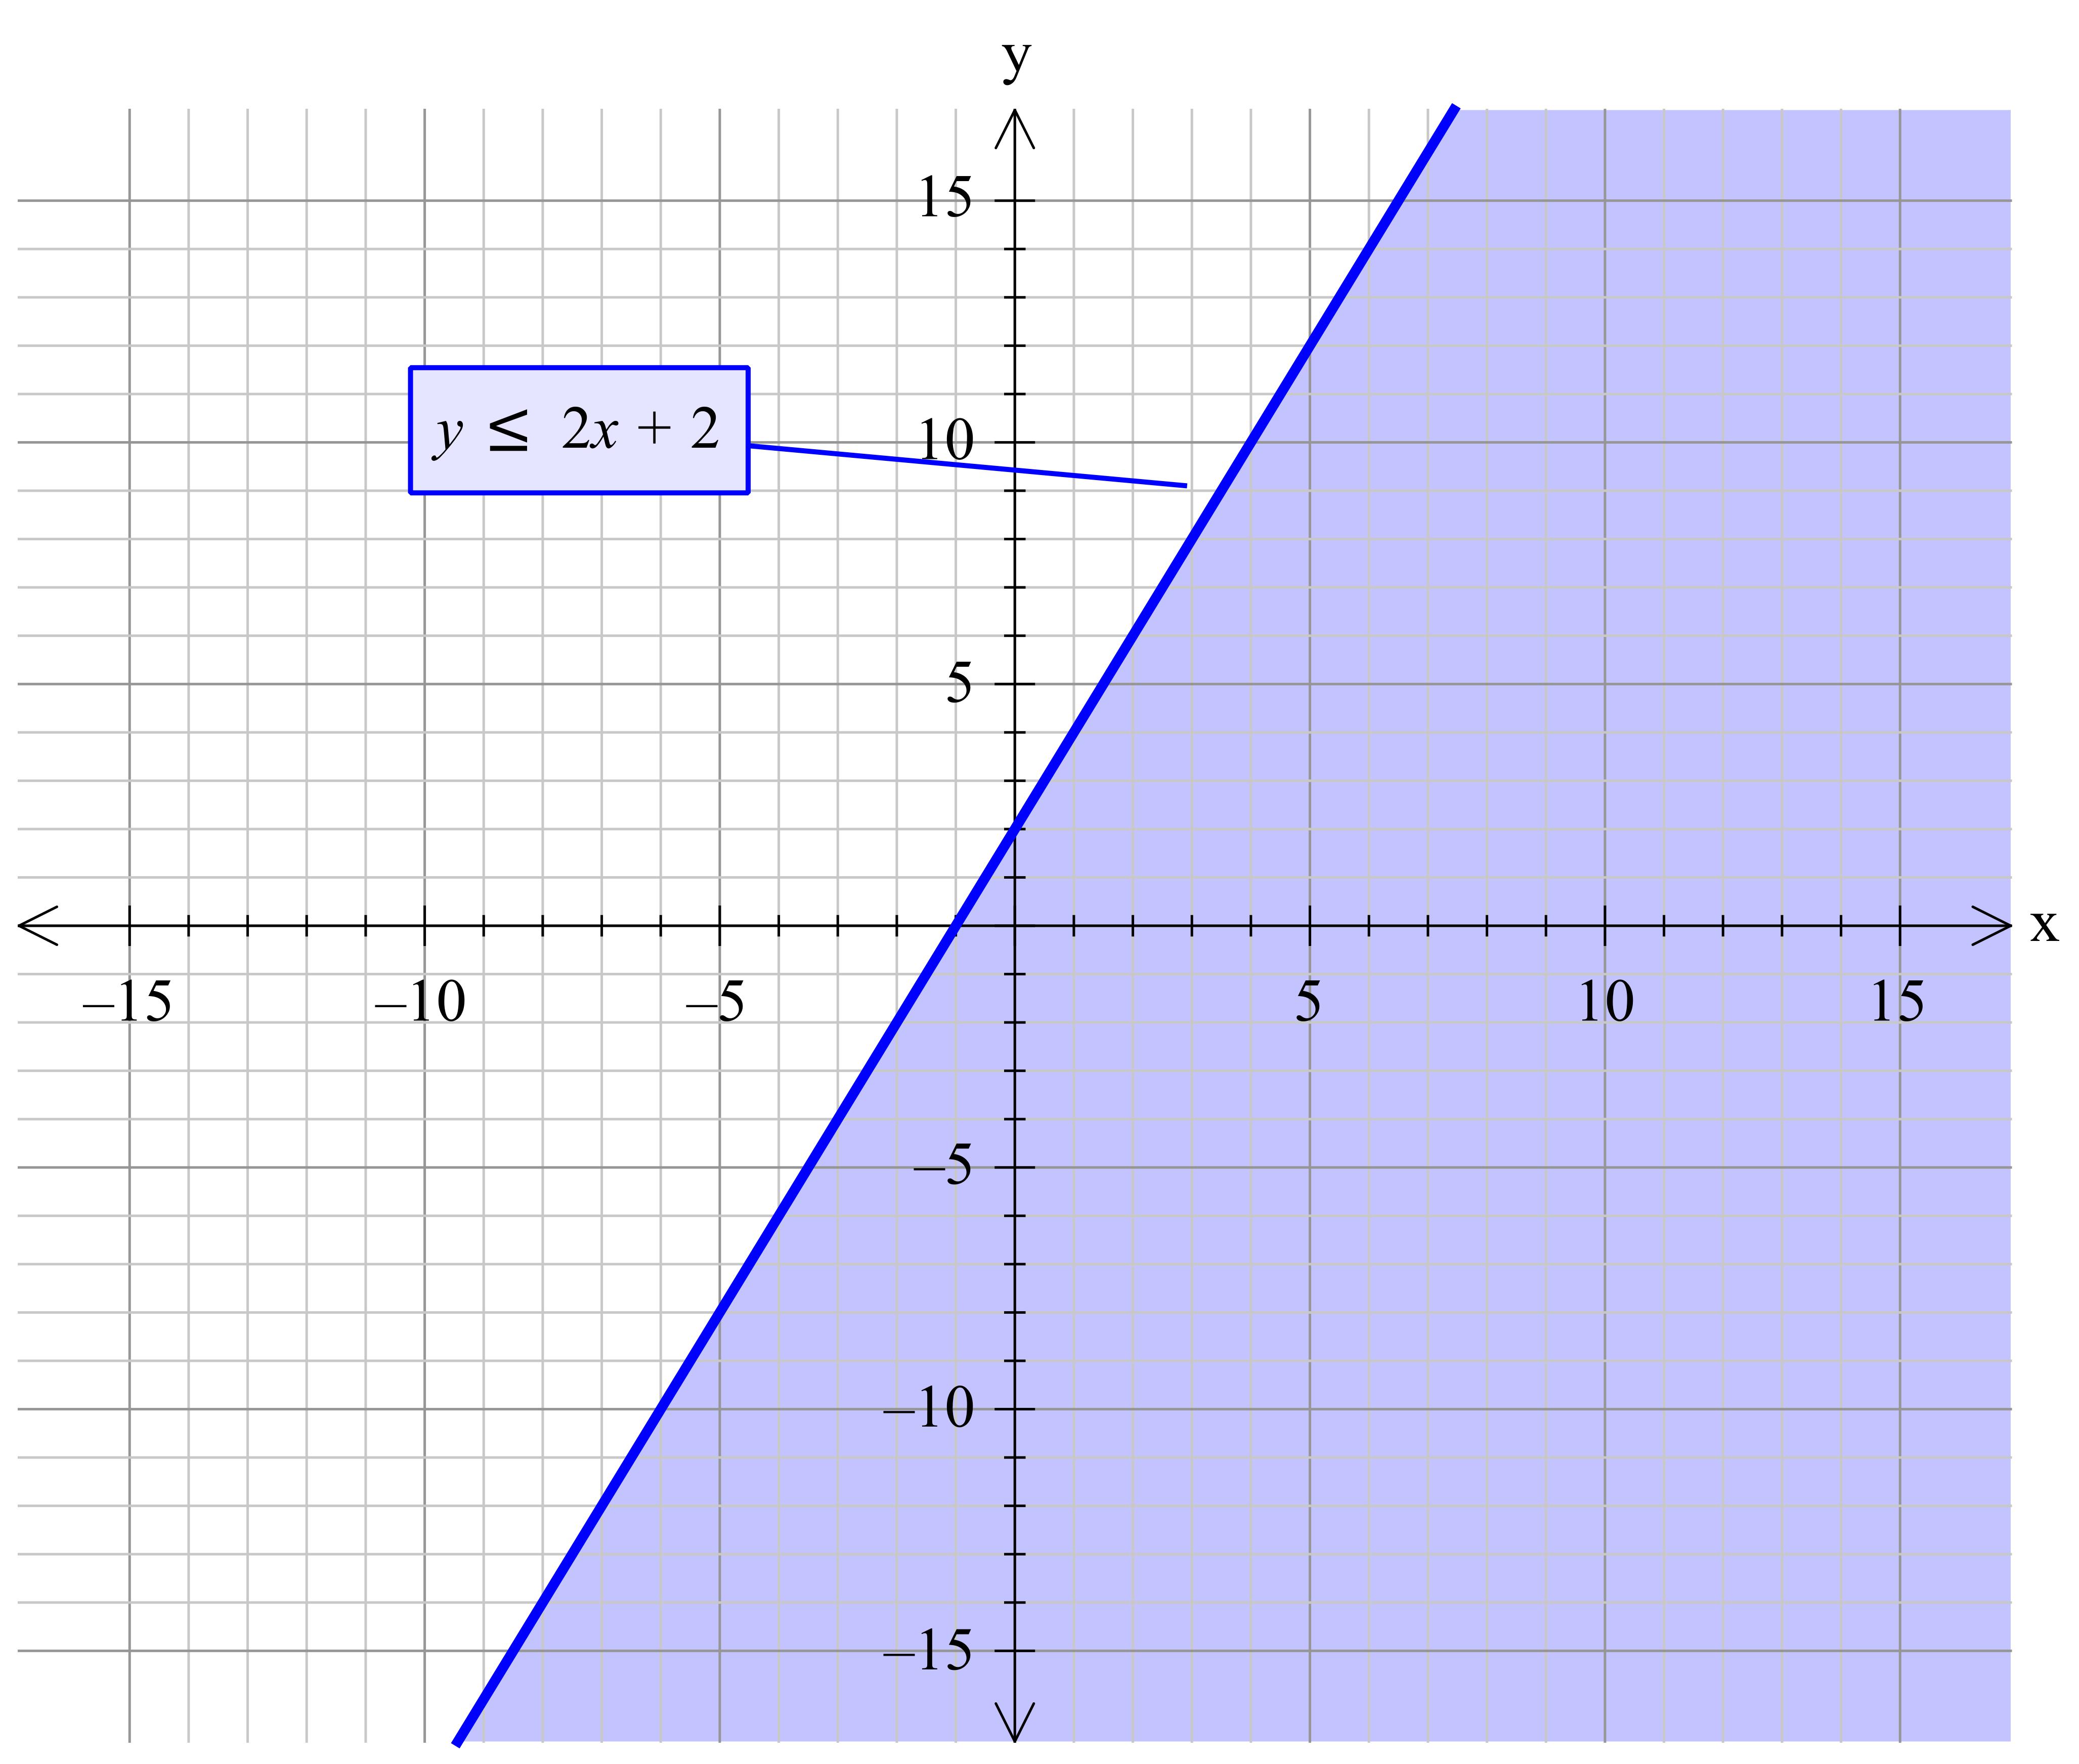
How do you graph the inequality #y<= 2x + 2#?

2 Answers
Aug 5, 2016

See the explanation.

Explanation:

Tony B

Suppose #x=3# then #2x+2=8#

So the inequality of #y<=2x+2# for #x=3# is saying:

#y# can be 8 and/or all the values less than 8

As #y# can actually assume the value of 8 the line is solid.

Suppose the equation had been #y<2x+2# in this instance if #x=3# then #y# is not permitted to assume the value of 8 but it is allowed to assume any of the values less than 8. In this case the line would be dotted.

Aug 5, 2016

Draw the line #y=2x+2# that passes through #(-1, 0 and (0, 2)#. Shade the region below. For any (x, y) on and beneath this line #y<=2x+2#.

Explanation:

Draw the line #y=2x+2#. It passes through #(-1, 0 and (0, 2)#. Shade

the region below this line.

For any point (x, y) on and beneath this linem #y<=2x+2#.