#f(x)=log_(1/3) (x+5)#
The vertical asymptote is found by setting #x+5# equal to zero.
#x+5=0 => x=-5#
The base of the log is #1/3#. A base that is less than one indicates that the graph is a decreasing log.
To find the #x# intercept, set #f(x)=0#
#0=log_(1/3) (x+5)#
Rewrite as an exponential and solve.
#(1/3) ^0 = x +5#
#1=x+5#
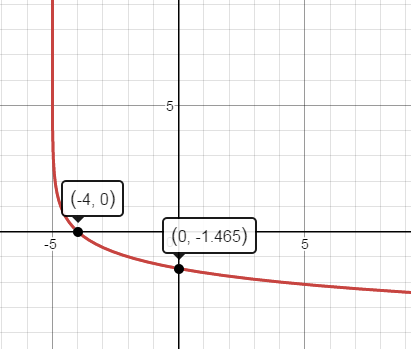
#x=-4# when #f(x)=0 =># the #x# intercept is #(-4,0)#
The #y# intercept is found by setting #x=0#
#y=log_(1/3) (0+5)#
#y=log_(1/3) 5#
Use the change of base formula # log_a b = logb/loga#
#y=log5/(log (1/3))=-1.46 =>#the #y# intercept is #(0, -1.46)#
See the graph below.
Alternatively, the function can be rewritten as an exponential and an #xy# table can be constructed by choosing values of #y# and finding corresponding #x# values.
#y=log_(1/3) (x+5)#
#x+5 = (1/3)^y#
#x=(1/3)^y -5#
Then choose values of #y# such as #-2,-1,0,1,2# and find the corresponding values of #x#. Plot the resulting #xy# coordinates.