Select a couple (arbitrary) values for x and for each solve to get corresponding y values; plot each set of coordinates; draw a line through those coordinates.
Explanation:
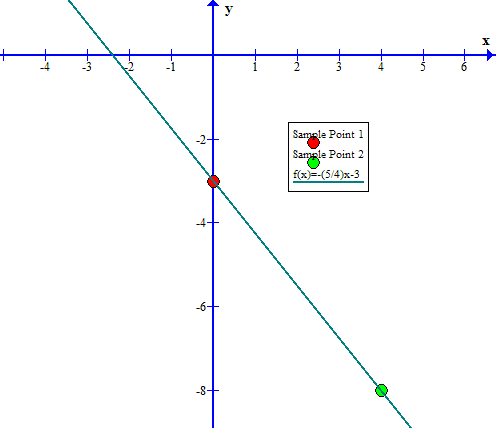
I used x=0 and x=4 as being fairly easy values to solve for y: color(white)("XXX"){:
(underline(x),color(white)("XX"),underline(y)),
(color(red)0,,color(red)(-3)),
(color(green)(4),,color(green)(-8))
:}