How do you graph #y>2^x-4#?

1 Answer
Dec 15, 2016

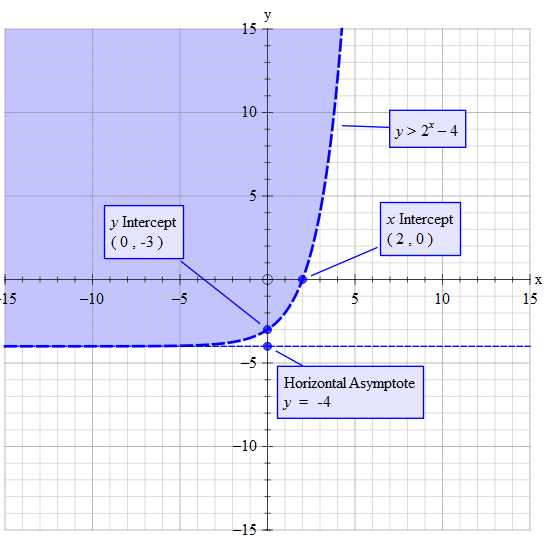
Plot #y=2^x-4# but with a dotted line.

The dotted line signifies that the value of y can never actually be #2^x-4#
Explanation:

Tony B

#color(blue)("Determine the key points")#

When #x=0" "ul("the dotted line")# goes through #y=1-4=-3#

When #y=0" "ul("the dotted line")# goes through #2^x=4=>x=2#

As #x# increases a lot #2^x# increases a lot and the influence of -4 from #y>2^x-4# becomes less and less until it becomes isignificant.

#" "lim_(x-> +oo) y >lim_(x->oo)2^x -> oo#

As #x# decreases it becomes negative so we have

#y>2^(-x)-4" "->" "y>1/(2^(+x))-4# giving:

#" "lim_(x->-oo) y> lim_(x->oo) 1/(2^x) -4 ->-4#