How does the water phase diagram differ from those of most substances?
1 Answer

The line separating the solid and liquid phases has a negative slope.
Explanation:
A phase diagram is a graph that shows what phases are present at any given temperature and pressure.
It usually has pressure on the vertical axis and temperature on the horizontal axis.
The regions separated by the lines tell us the conditions of
The lines themselves represent the combinations of
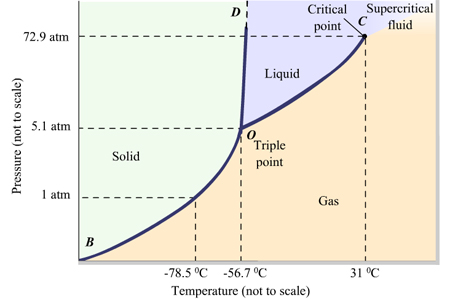
The phase diagram for most substances looks like this.
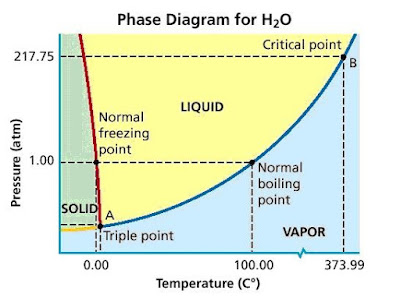
However, the phase diagram for water looks like this.
Can you spot the difference?
Normally, as in
However, the corresponding line in water (the red line) has a negative slope.
As you increase the pressure, the density of a substance increases.
Thus, the negative slope indicates that the liquid phase has a greater density than the solid phase.
In other words, the density of ice is less than that of water.
For most other common substances, the solid is denser than the liquid.
