How do you graph #Y=|-1/2x-3|# by plotting points?
1 Answer
Feb 20, 2017
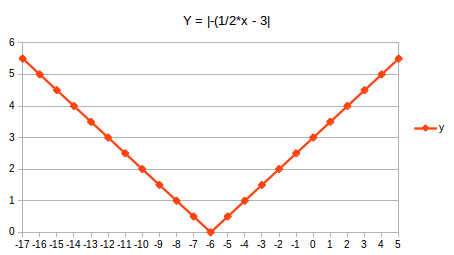
Set up a table with x and y values. Calculate and plot. An absolute value function will always be a mirror image.
Explanation:
This chart was made by plotting x-values from -17 to +5 and the corresponding calculated y values.


