How do you graph #y=ln(x+3)#?
1 Answer

Feb 28, 2017
Explanation:
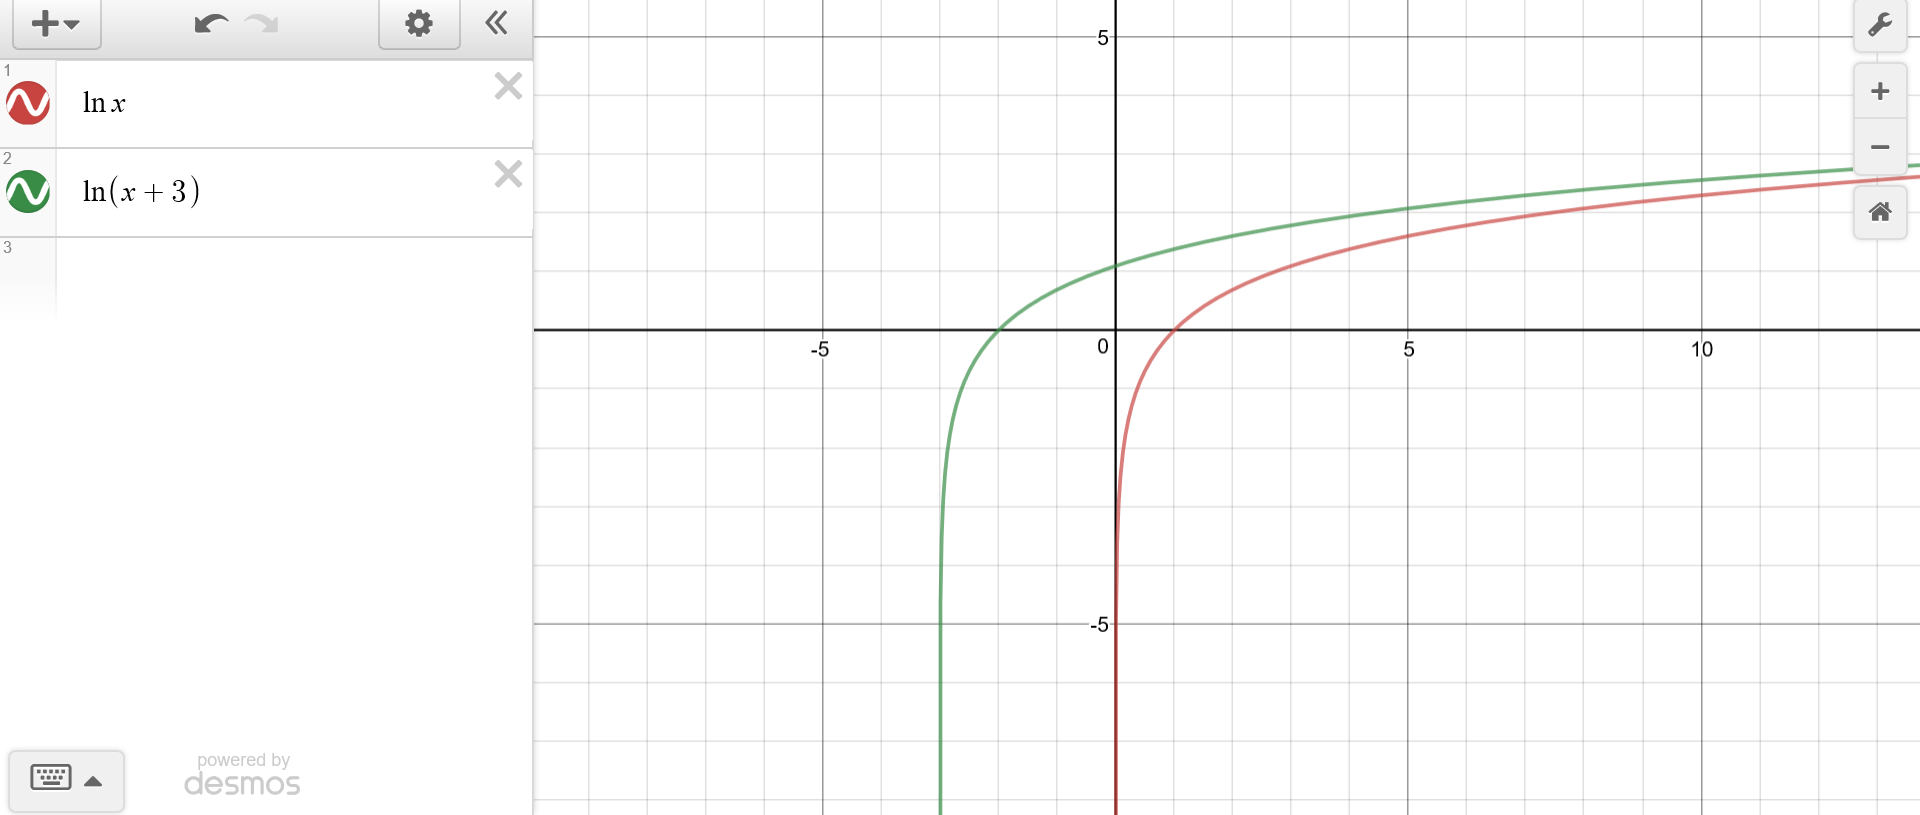
Look at graph:
It is helpful to now that the function ln(x) naturally has an x-intercept at 1 (or in coordinate form (1,0). Also, the function ln(x) has a vertical asymptote at x=0.
In order to graph ln(x+3) it is helpful to reference ln(x)
Applying the transformation rules, every x value is being shifted or translated 3 units to the left. Doing this manually, you take the point (1,0) and shift the x value 3 units to the left. Thus, your new point is (-2,0). Also note that the vertical asymptote is now x=-2 so when you graph the function draw your line getting closer to -2 but not actually touching -2 from the left while the right keeps on increasing.
