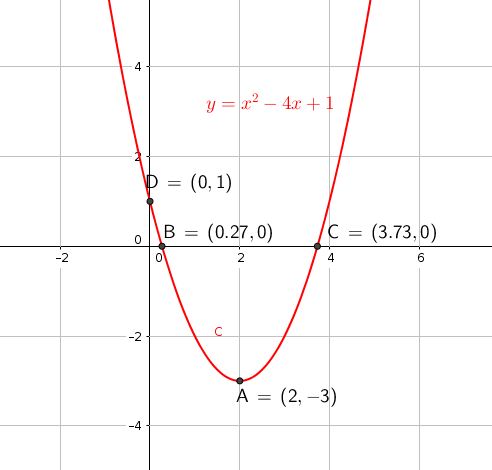
How do you graph # y=(x-2)^2-3#?
2 Answers
see explanation.
Explanation:
To sketch the parabola we require.
#• " x and y intercepts"#
#• " coordinates of vertex"#
#• " whether maximum or minimum"#
#color(blue)"x and y intercepts"#
#"let x = 0"toy=(-2)^2-3=1to(0,1)#
#" let y = 0"to(x-2)^2-3=0#
#rArr(x-2)^2=3# Take
#color(blue)"square root of both sides"#
#sqrt((x-2)^2)=+-sqrt3#
#rArrx-2=+-sqrt3#
#rArrx=sqrt3-2~~0.27to(0.27,0)#
#color(blue)"coordinates of vertex"# The equation of a parabola in
#color(blue)"vertex form"# is.
#color(red)(bar(ul(|color(white)(2/2)color(black)(y=a(x-h)^2+k)color(white)(2/2)|)))#
where (h ,k) are the coordinates of the vertex and a is a constant.
#y=(x-2)^2-3" is in this form"#
#rArr(2,-3)larrcolor(red)" coordinates of vertex"#
#color(blue)"maximum/minimum"#
#• " If " a>0" then minimum " uuu#
#• " If " a>0" then maximum " nnn#
#"here " a>0rArr" minimum"# Utilising these key elements should enable a sketch of the graph to be made.
graph{(x-2)^2-3 [-10, 10, -5, 5]}
Explanation:


