How do you graph #y=4/3sqrt(x)#?
2 Answers

Try different x values and plot accordingly
Explanation:
If you assign
If you assign
If you assign
etc. On the negative side your function is not defined.
Now plot accordingly.
graph{(4/3)sqrtx [-3, 20, -2, 10]}

See explanation
Explanation:
Suppose the square root of
Example
So
Thus
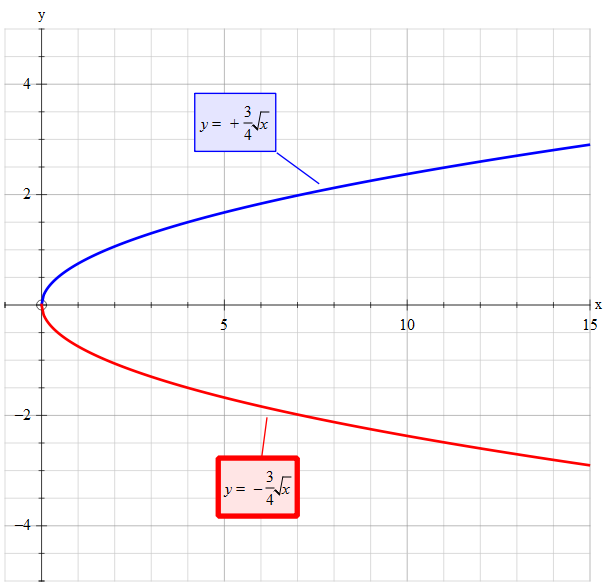
If you wish the numbers to remain in the real domain
That is:
~~~~~~~~~~~~~~~~~~~~~~~~~~~~~~~~~~~~~~~~~~~~~
Consequently the graph is split into 2 parts
First part:
Second part