How do you graph the inequality # 3x + 4y<12#, #x + 3y<6#, #x>=0#, #y>=0#?
1 Answer

May 21, 2017
Assumption: You do not need to be shown how to manipulate equation.
Explanation:
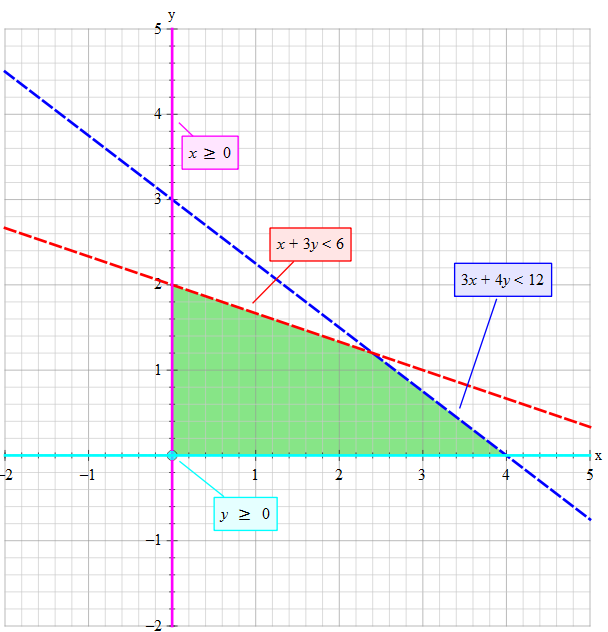
It is a matter of determining the area or areas for which all these conditions are true. This/these areas are shaded on the graph.
Note that if the inequality includes the equals then the line is solid. On the other hand if inequality does not include the equals then the line is dotted.
So