How do you graph the system of linear inequalities #2x+1>=y# and #x<5# and #y<x+2#?

1 Answer
Jun 25, 2017

Draw solid or dashed lines corresponding to equations, then test the origin, #(0,0)#, to shade. Where all three overlap is the final answer.

Explanation:

One way to graph a system of linear equations like this is to actually start by drawing them as if they were equalities first.

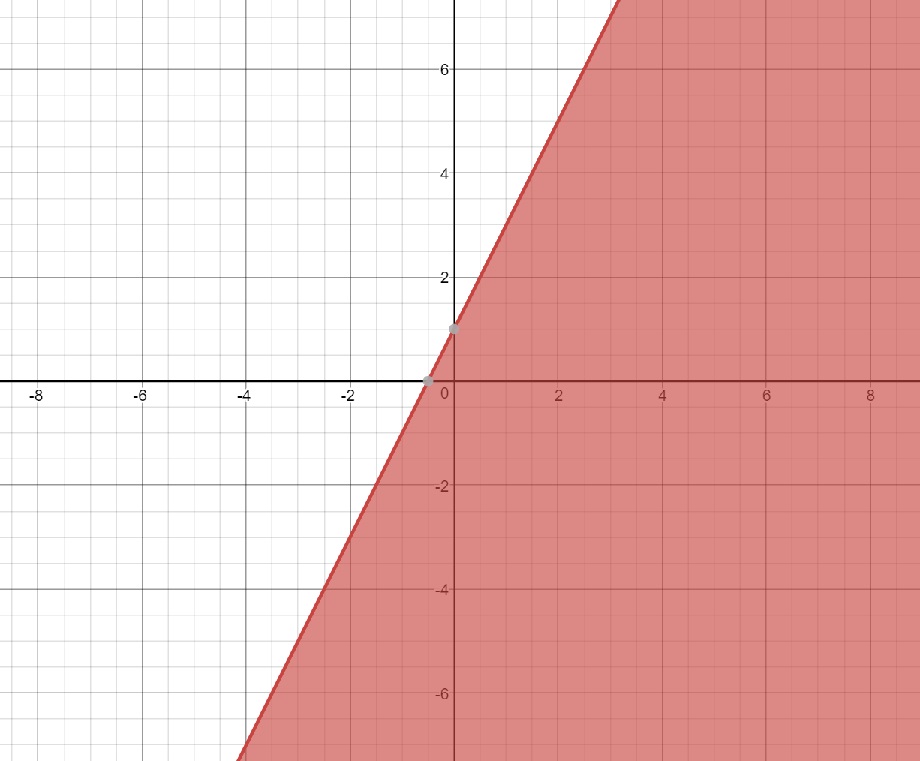
The inequality #2x+1 >= y# becomes #y=2x+1# When you graph that, you get
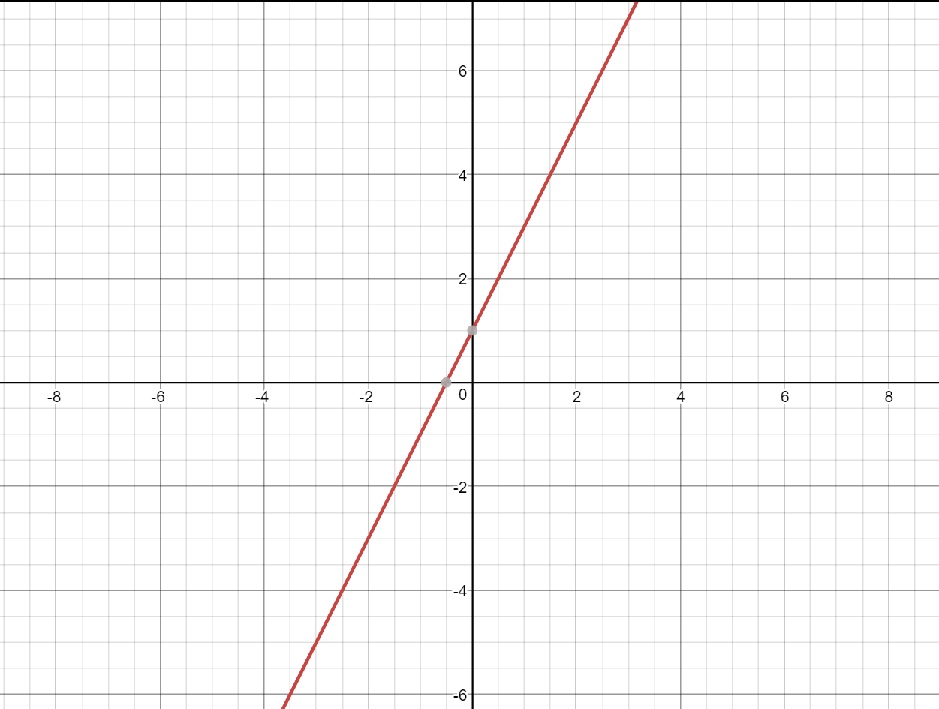
Desmos.com and MS Paint

Testing the point #(0,0)#, you see that it's true that #1 >= 0#, so shade that side. Because the inequality is "less then or equal to", you draw a solid (not dashed) line.
Desmos.com and MS Paint

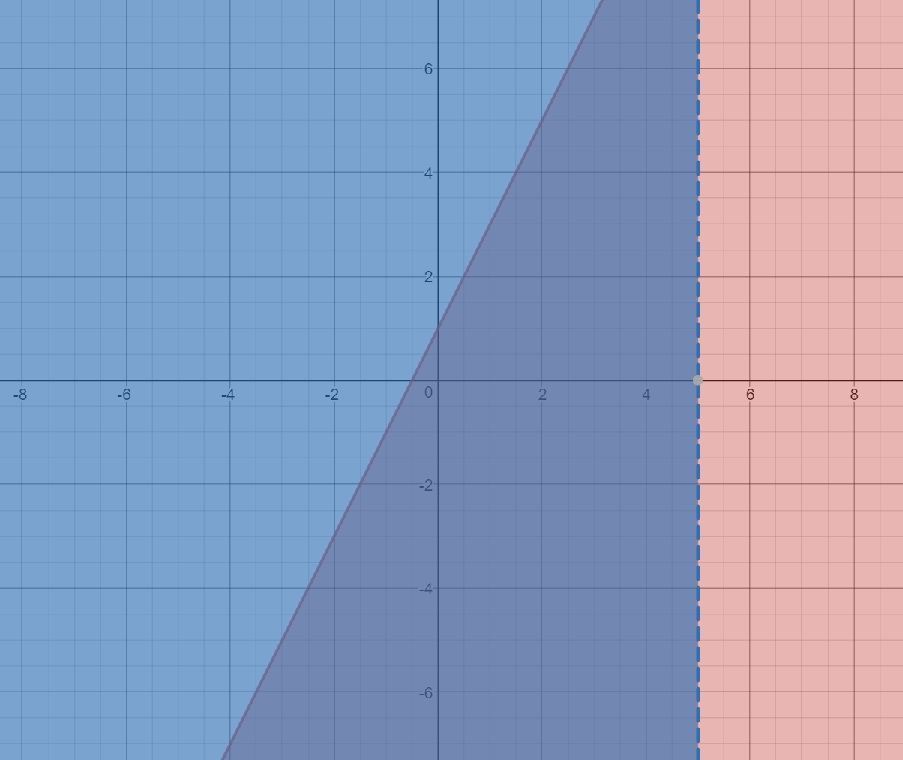
Again, assume #x < 5# is really just #x=5#. This gives:
Desmos.com and MS Paint

This time, the graph is dashed because you were given #x < 5#. Testing the point #(0,0)#, it is true that #x=0# is less than #5#, so we shade to the left.

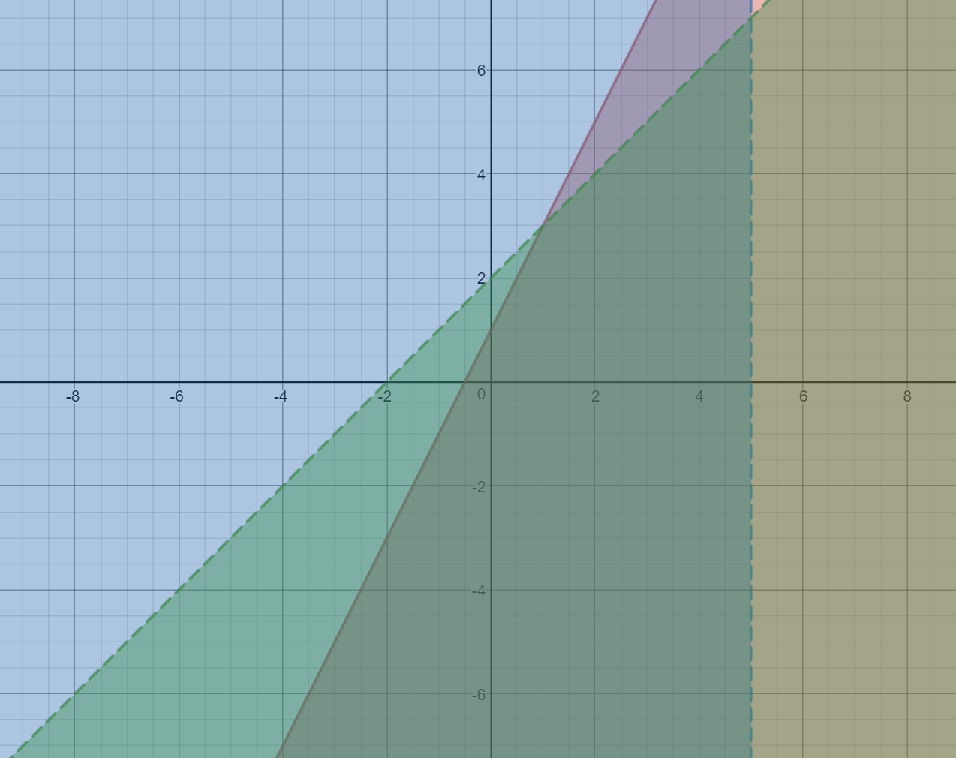
Finally, pretending to graph #y < x+2# gives the line. We must used a dashed line and shade wherever the inequality is true. At the point, #(0,0)#, the inequality is false, which means we must shade the other side.
Desmos.com and MS Paint

Finally, if we are to find out where ALL THREE inequality are true, you simply look for the solution where ALL THREE shaded parts overlap. That occurs here:
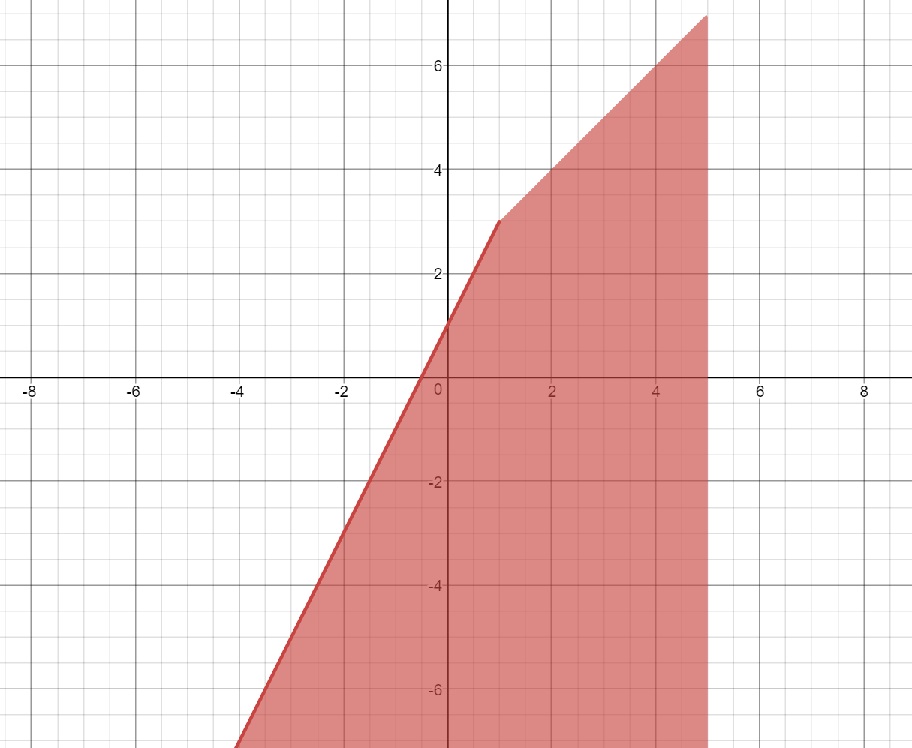
Desmos.com and MS Paint