How is the graph of #g(x)=6+4/3x^2# related to the graph of #f(x)=x^2#?

1 Answer

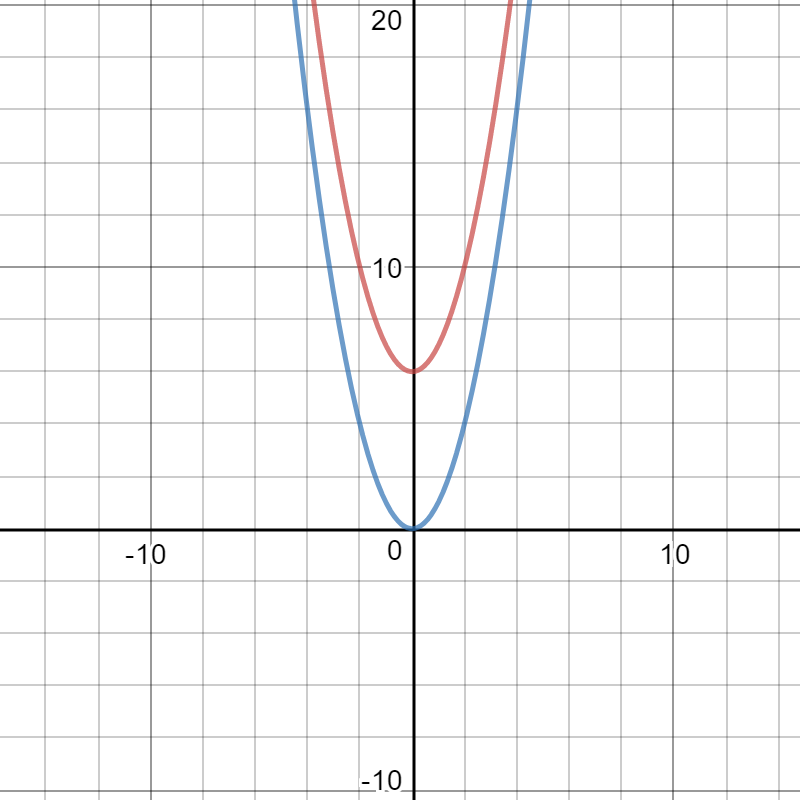
By comparing graphs, we observe that multiplying the square term by an number greater than #1# makes the parabola rise more sharply and adding a constant shifts it vertically.

Explanation:

Please observe the graphs #y = x^2# (in red), #y = 4/3x^2# (in blue) and #y = 1/3x^2# (in green)

Desmos.com

For the equation #y = ax^2; a > 0#

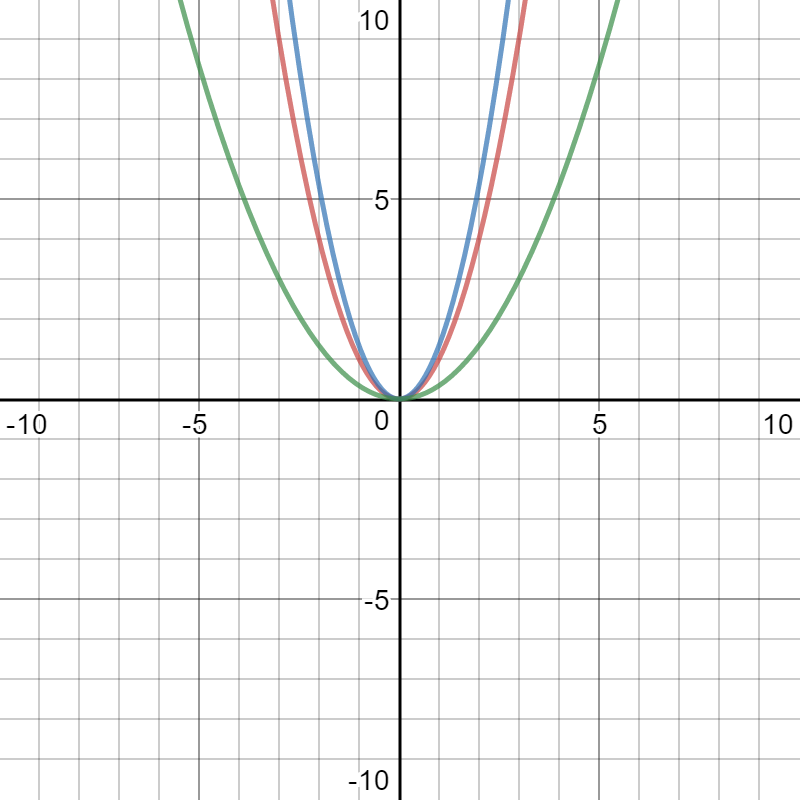
The larger that you make the coefficient #a#, the greater the value of #y# for a given value of #x#; this makes the graph rise more sharply.

Please observe the graphs #y = x^2# (in blue) and #y = x^2+6# (in red) the latter is shifted vertically by #6#.
Desmos.com